The Goal
For a long time now, I really wanted to have some kind of physical display for my homelab. One that would tell me how the infrastructure is doing, at a glance. Besides, I love blinkenlights.
Given there’s a myriad of solutions to choose from, I began with identifying my requirements:
- Physical:
- Fits in a 10“ rack.
- Displayed information is legible at an arm’s distance or less.
- Does not cover the already installed servers.
- Does not prevent access to the power strip and PSUs, or at least easily and reliably removable (e.g. magnets instead of screws).
- Electrical:
- ≤ 1W power consumption on average.
- Wall powered.
- Other:
- Can convey basic information about the system’s state, like CPU, memory, disk space.
- Refresh rate of at least once every 5 seconds.
- Preferably low cost – don’t break the bank with a high-DPI, multicolor, e-ink display.
First Approach – the Dot Display
My first idea was to browse through some cheap LCD/OLED display modules available online. One type of small displays I like particularly are dot displays. They tend to evoke a feeling of nostalgia in me, possibly for a world that I never even had a chance to experience. That’s because I always imagined William Gibson’s netrunners using retrofuturistic displays. You know, nixie tubes, 14-segments, dot matrices, CRTs, and finally large-pixel displays.
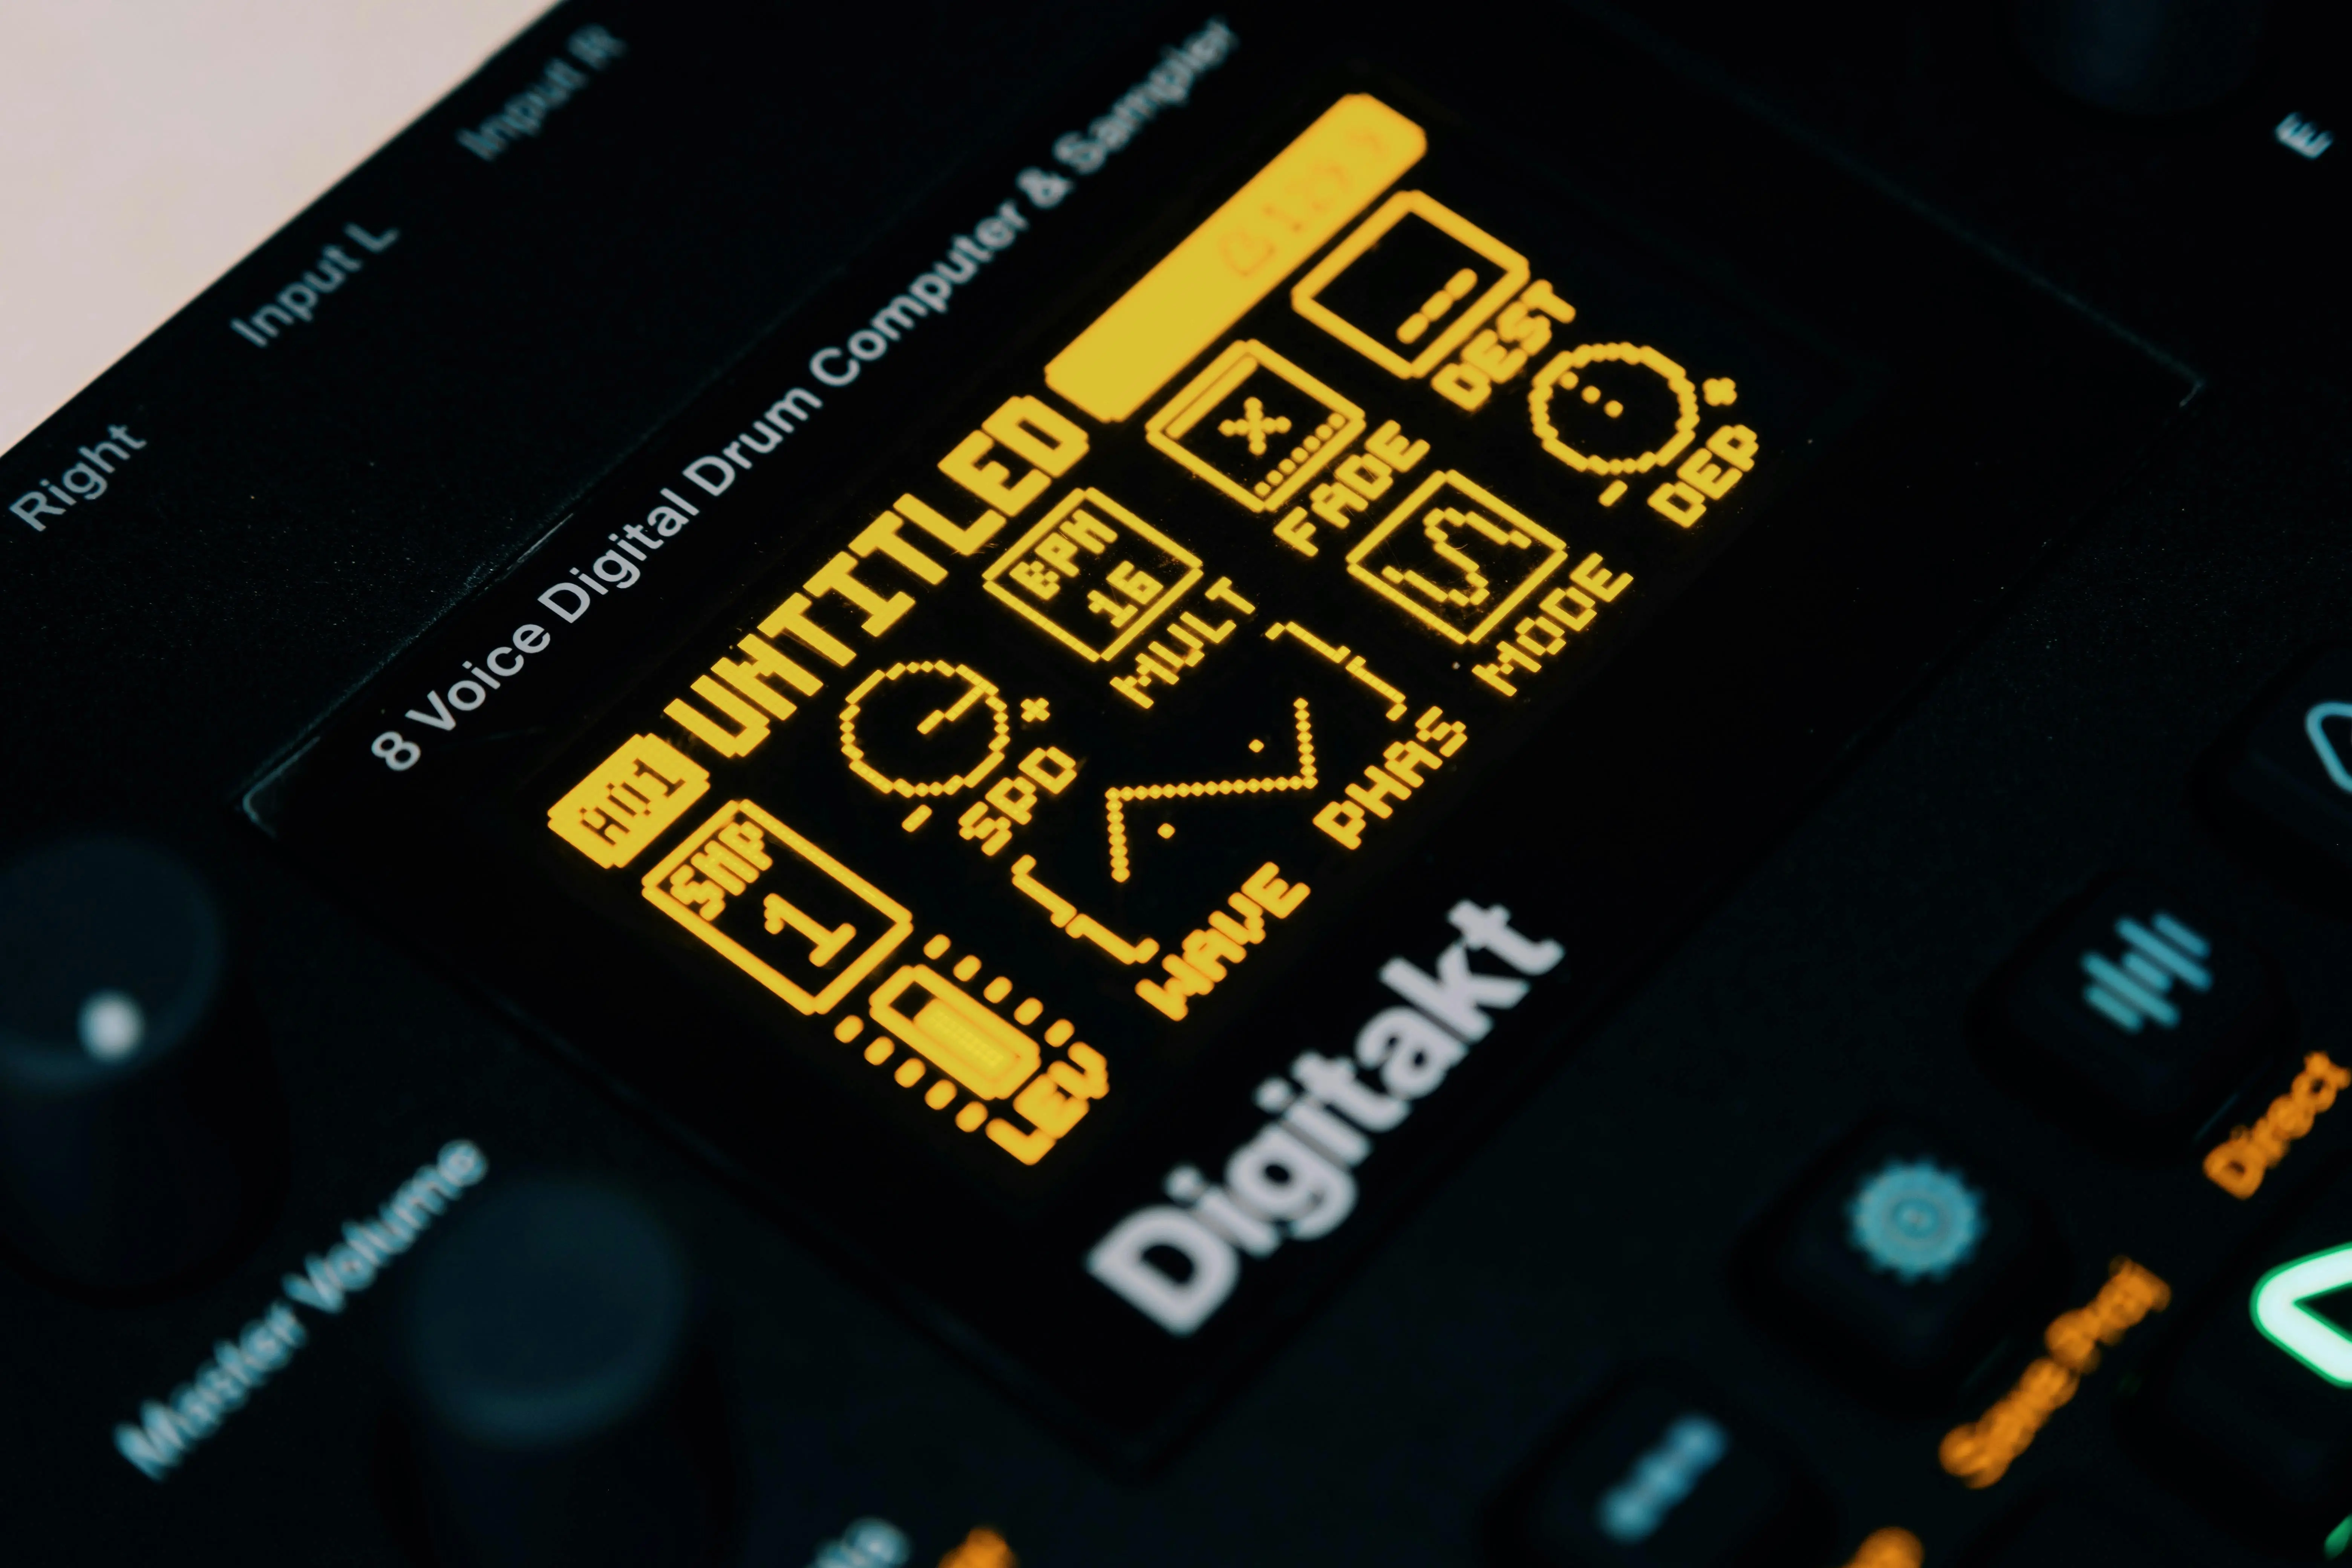
My favorite application of dot displays to date is the Elektron Digitakt I (2017), whose designers masterfully navigated the limitations of that canvas, to create a user interface that’s both informative and mesmerizing alike. My friend happens to have one – I absolutely adore the animations.
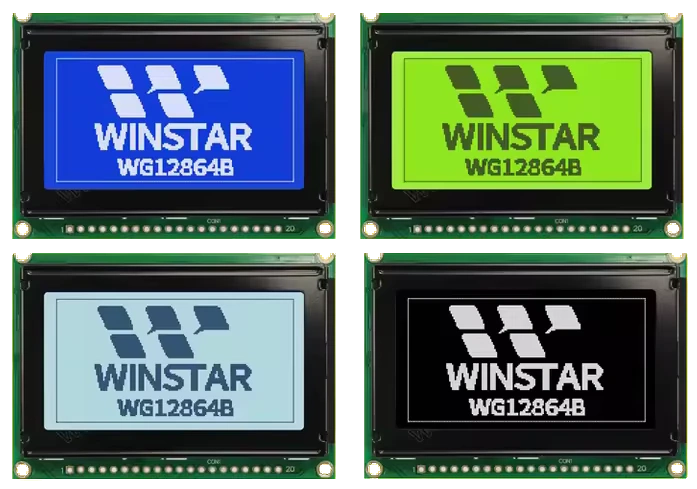
A commonly found dot display is the 12864 LCD, available in several sizes. They’re quite popular in CNC machine control panels, for example in 3D printers. Their price is relatively low at around 20-40PLN, and they typically interface via SPI or I²C. They unfortunately don’t come in a black&yellow variant, with the closest alternative being black&white.
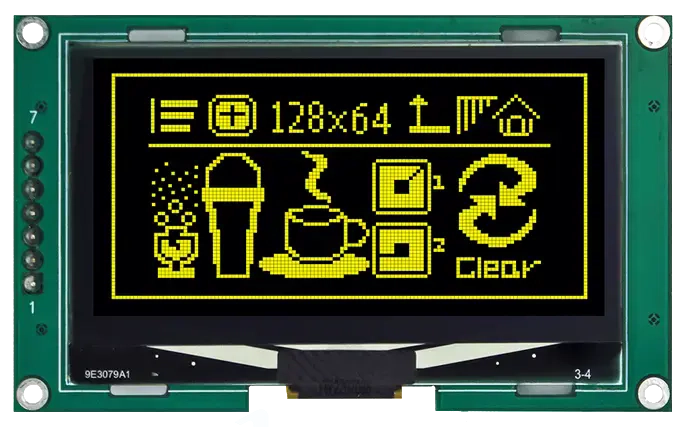
Initially, I thought the Digitakt simply has a black&white display with a yellow filter embedded into or overlaid onto it. But then, I found what I believe to be the exact part match, the 2.42“ yellow OLED display (SSD1309):
System Design
Variant A – On Host

The host machine will run a Python service (OLED display server), which will fetch monitoring data, and draw it on the display.
- The host machine will interface with the display via a USB-I²C adapter.
- The USB-I²C adapter will be implemented by flashing a RP2040 board with I²C adapter firmware [1]. Alternatively, a pre-made adapter can be purchased.
- The I²C adapter will implement the i2c-tiny-usb protocol, to facilitate integration with the Linux USB project.
- The service will utilize the luma.oled library to interact with the display(s).
- The service will fetch the required monitoring data through the network, from a Prometheus server.
Pros:
- Centralized implementation of the fetch/draw logic.
- Fast development cycle.
- Ease of debugging.
- Can run on any host, as long as there’s network access to the target Prometheus instance.
Cons:
- Potential inability to drive multiple displays via one RP2040, even though the chip has two I²C buses.
- The device is not standalone, requires a host to run the Python service.
Variant B – Split

The host machine will run a lightweight Python service (Metrics relay). The service will fetch metrics from Prometheus and relay them to the I2C-capable device (Display server) via UART. The device draws on the multiple displays.
- Data transfer format between the metrics relay and the display server is irrelevant, as long as both parties support it. Protocol Buffers could be adopted to facilitate unified data structure definition and serialization.
Pros:
- Multiple displays can be driven using a I2C-capable device. I2C multiplexers can be used to further increase the effective I2C address space.
Cons:
- Application code is scattered across two runtimes.
- The development lifecycle will involve two separate deliverables, creating a risk factor of interface drift. In other words, the display server cannot render the user interface without receiving the necessary data in the first place. The metrics relay must satisfy the information requirements of the display server.
- Requires extra glue code to link the devices.
- Timing concerns arise, and what about communications breakdown (e.g. loose UART connection)?
- Data integrity may be compromised.
- Overall this variant exhibits high complexity, with no clear benefit.
Variant C – Standalone

This is an improvement of Variant B, cutting out the middle man.
- An ESP32 will run as a standalone, Rust–based embedded system.
- Network connection will be provided via WiFi.
- The system will fetch the metrics directly from Prometheus, process the data locally, and render the user interface out to the displays via I2C.
Pros:
- Leverages the pros of variant B, while eliminating its cons, it’s a win-win scenario.
- While clear delineation between frontend (UI) and backend (metrics fetching) logic shall be maintained, this approach is still far simpler than variant B.
- Simple, unified architecture.
Cons:
- My cat is probably better at Rust than I am, but I can git gud.
- Can’t see any real downsides, this is a really good approach in my opinion.
Second Approach – Repurposed Smartphone
The first approach has a significant caveat, in that it requires building (and maintaining) a fully custom display solution. I later remembered I had an old Android phone laying around. The phone was defective, but not in a way that would prevent me from using it as a dashboard. I’ve decided to pursue this idea instead.
System Design

The Android phone will run the Grafana in a web browser.
- The web browser of choice will be the Fully Kiosk browser. It provides lifecycle automation capabilities unavailable in typical web browsers.
- Custom dashboards will be made to accomodate the aspect ratio and size of the phone’s display.
Pros:
- Android provides nearly all of the necessary facilities out of the box – wireless networking, high-density display, app runtime, and touch input.
- Highly flexible environment, possible to repurpose in the future.
Cons:
- Hardware modifications will be required to adapt the phone to long-term grid power operation.
- Battery cell must be removed to prevent spicy pillows and spontaneous combustion.
Hardware Modifications
With considerable effort and anxiety about puncturing, I’ve removed the Lithium-ion battery from the phone. This left me with an empty cavity inside the phone’s body to install extra hardware.
I’ve quickly learned that simply removing the battery wasn’t sufficient for the phone operate just on USB power. It appears smartphones tend to check their battery upon boot (like a self-test). For this particular phone (Nokia G22), failing the check results in a bootloop.
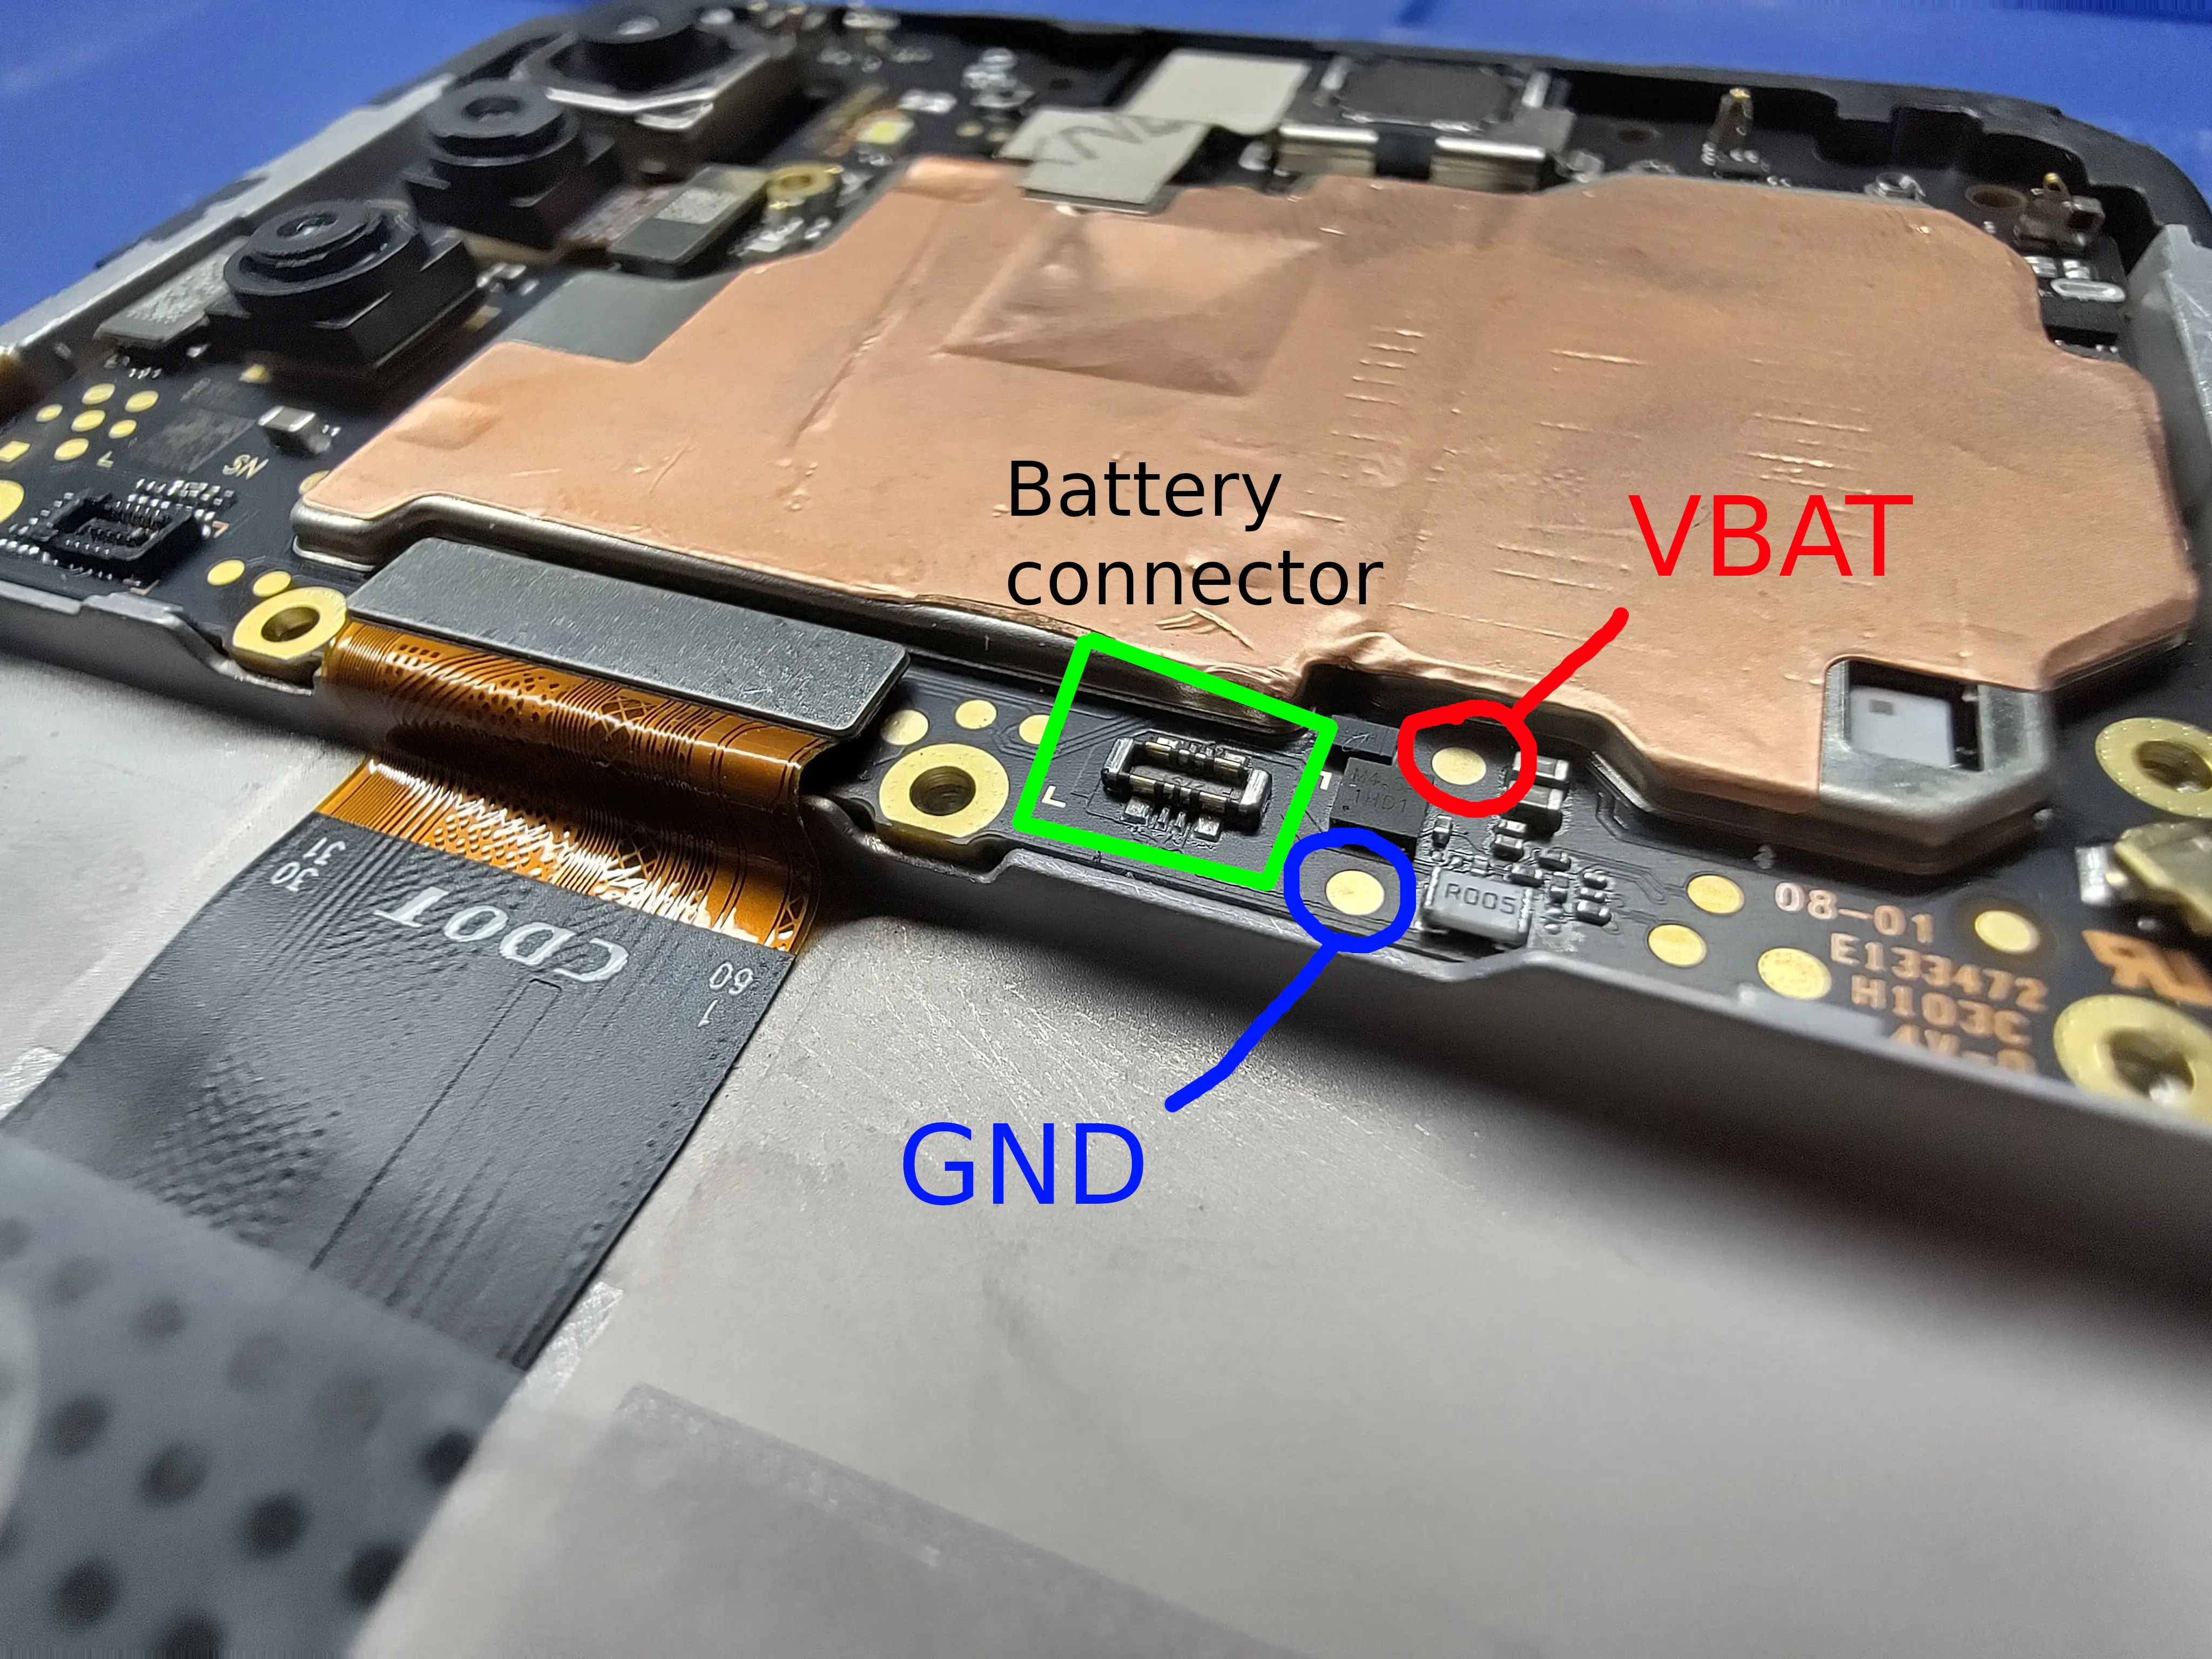
Inspecting the power connector with a continuity tester proved that the battery connector has just two terminals, and therefore it cannot transmit any data (think serial number, manufacturing date, etc.). An obvious conlusion from this observation, is that the mainboard can only check the battery voltage level at any point in time. This in turn implies the mainboard can be cheated to “think” there’s a working battery, by supplying a battery-like voltage on the battery connector.
By battery-like, I mean any voltage within the nominal range of operation for a Lithium-ion battery. That happens to be somewhere between 3.0V and 4.2V. Given USB typically provides ~5.0V, a reference battery voltage could be created with any electronic component exhibiting a stable forward voltage drop of at least ~0.8V, and at most ~2V (assuming an ideal circuit).
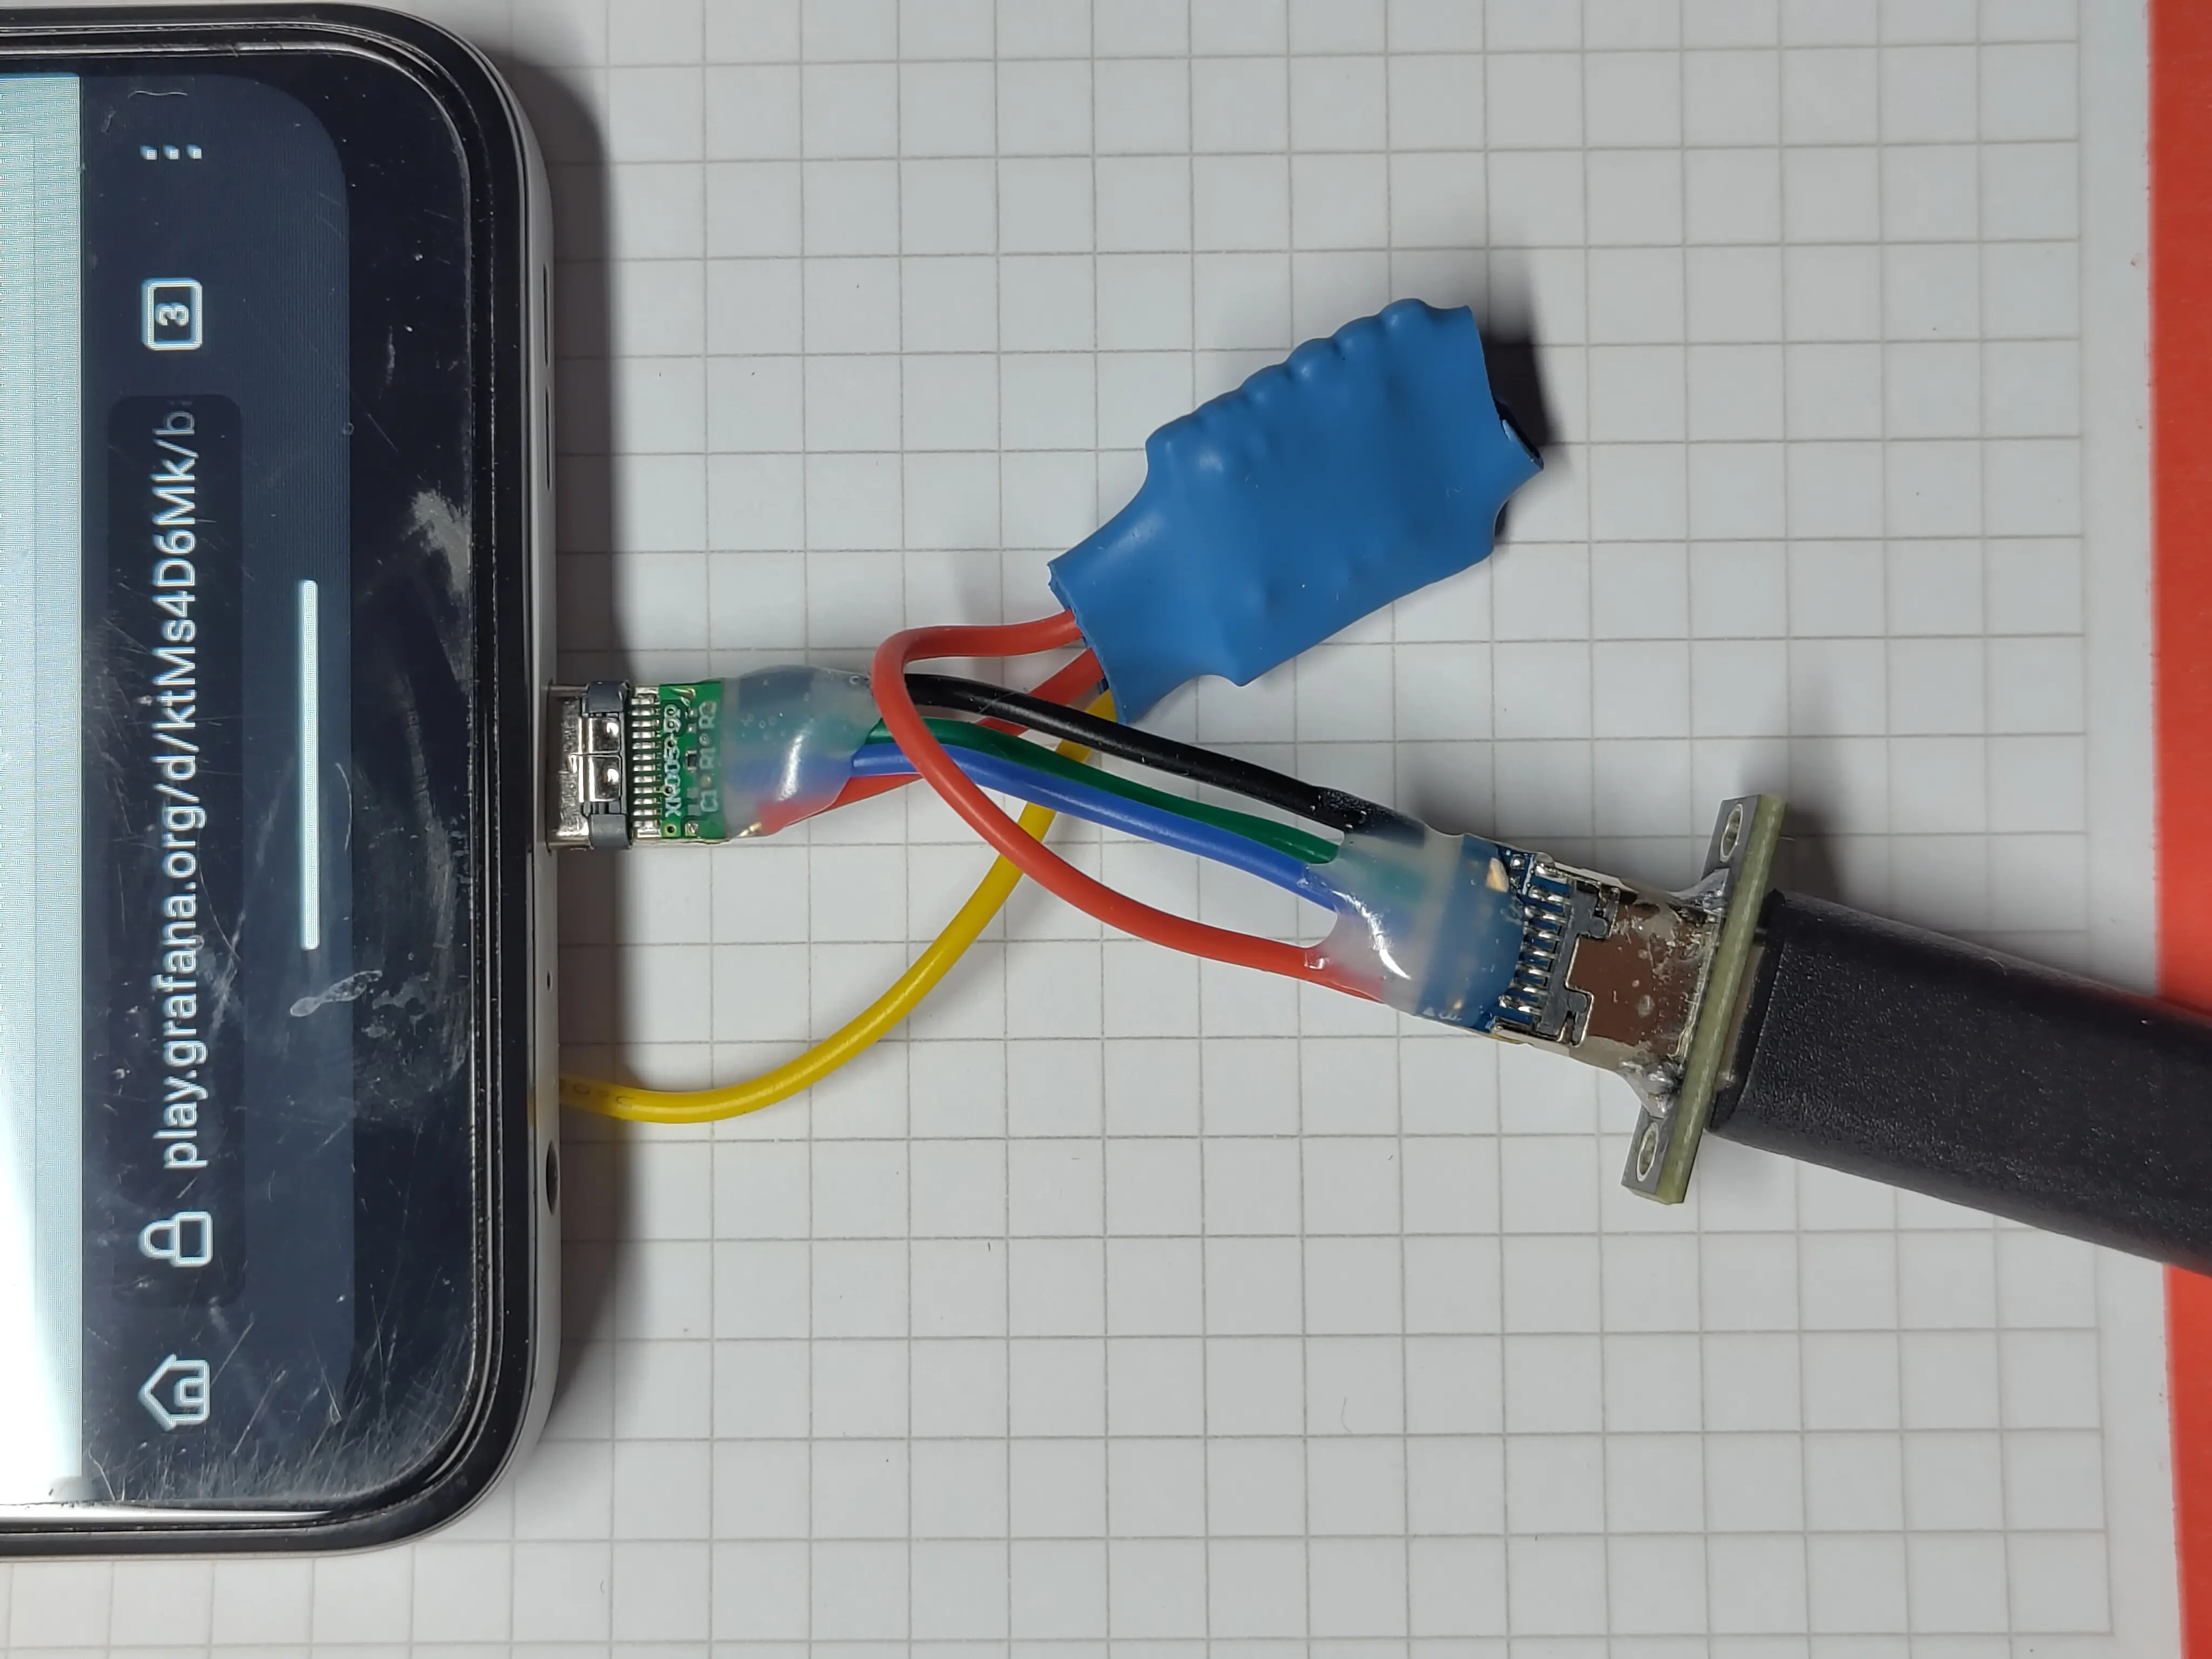
I’ve confirmed this hypothesis by soldering two wires to conveniently placed battery test pads, and feeding 4.2V with a lab PSU, while simultaneously providing USB power. The phone booted just fine.
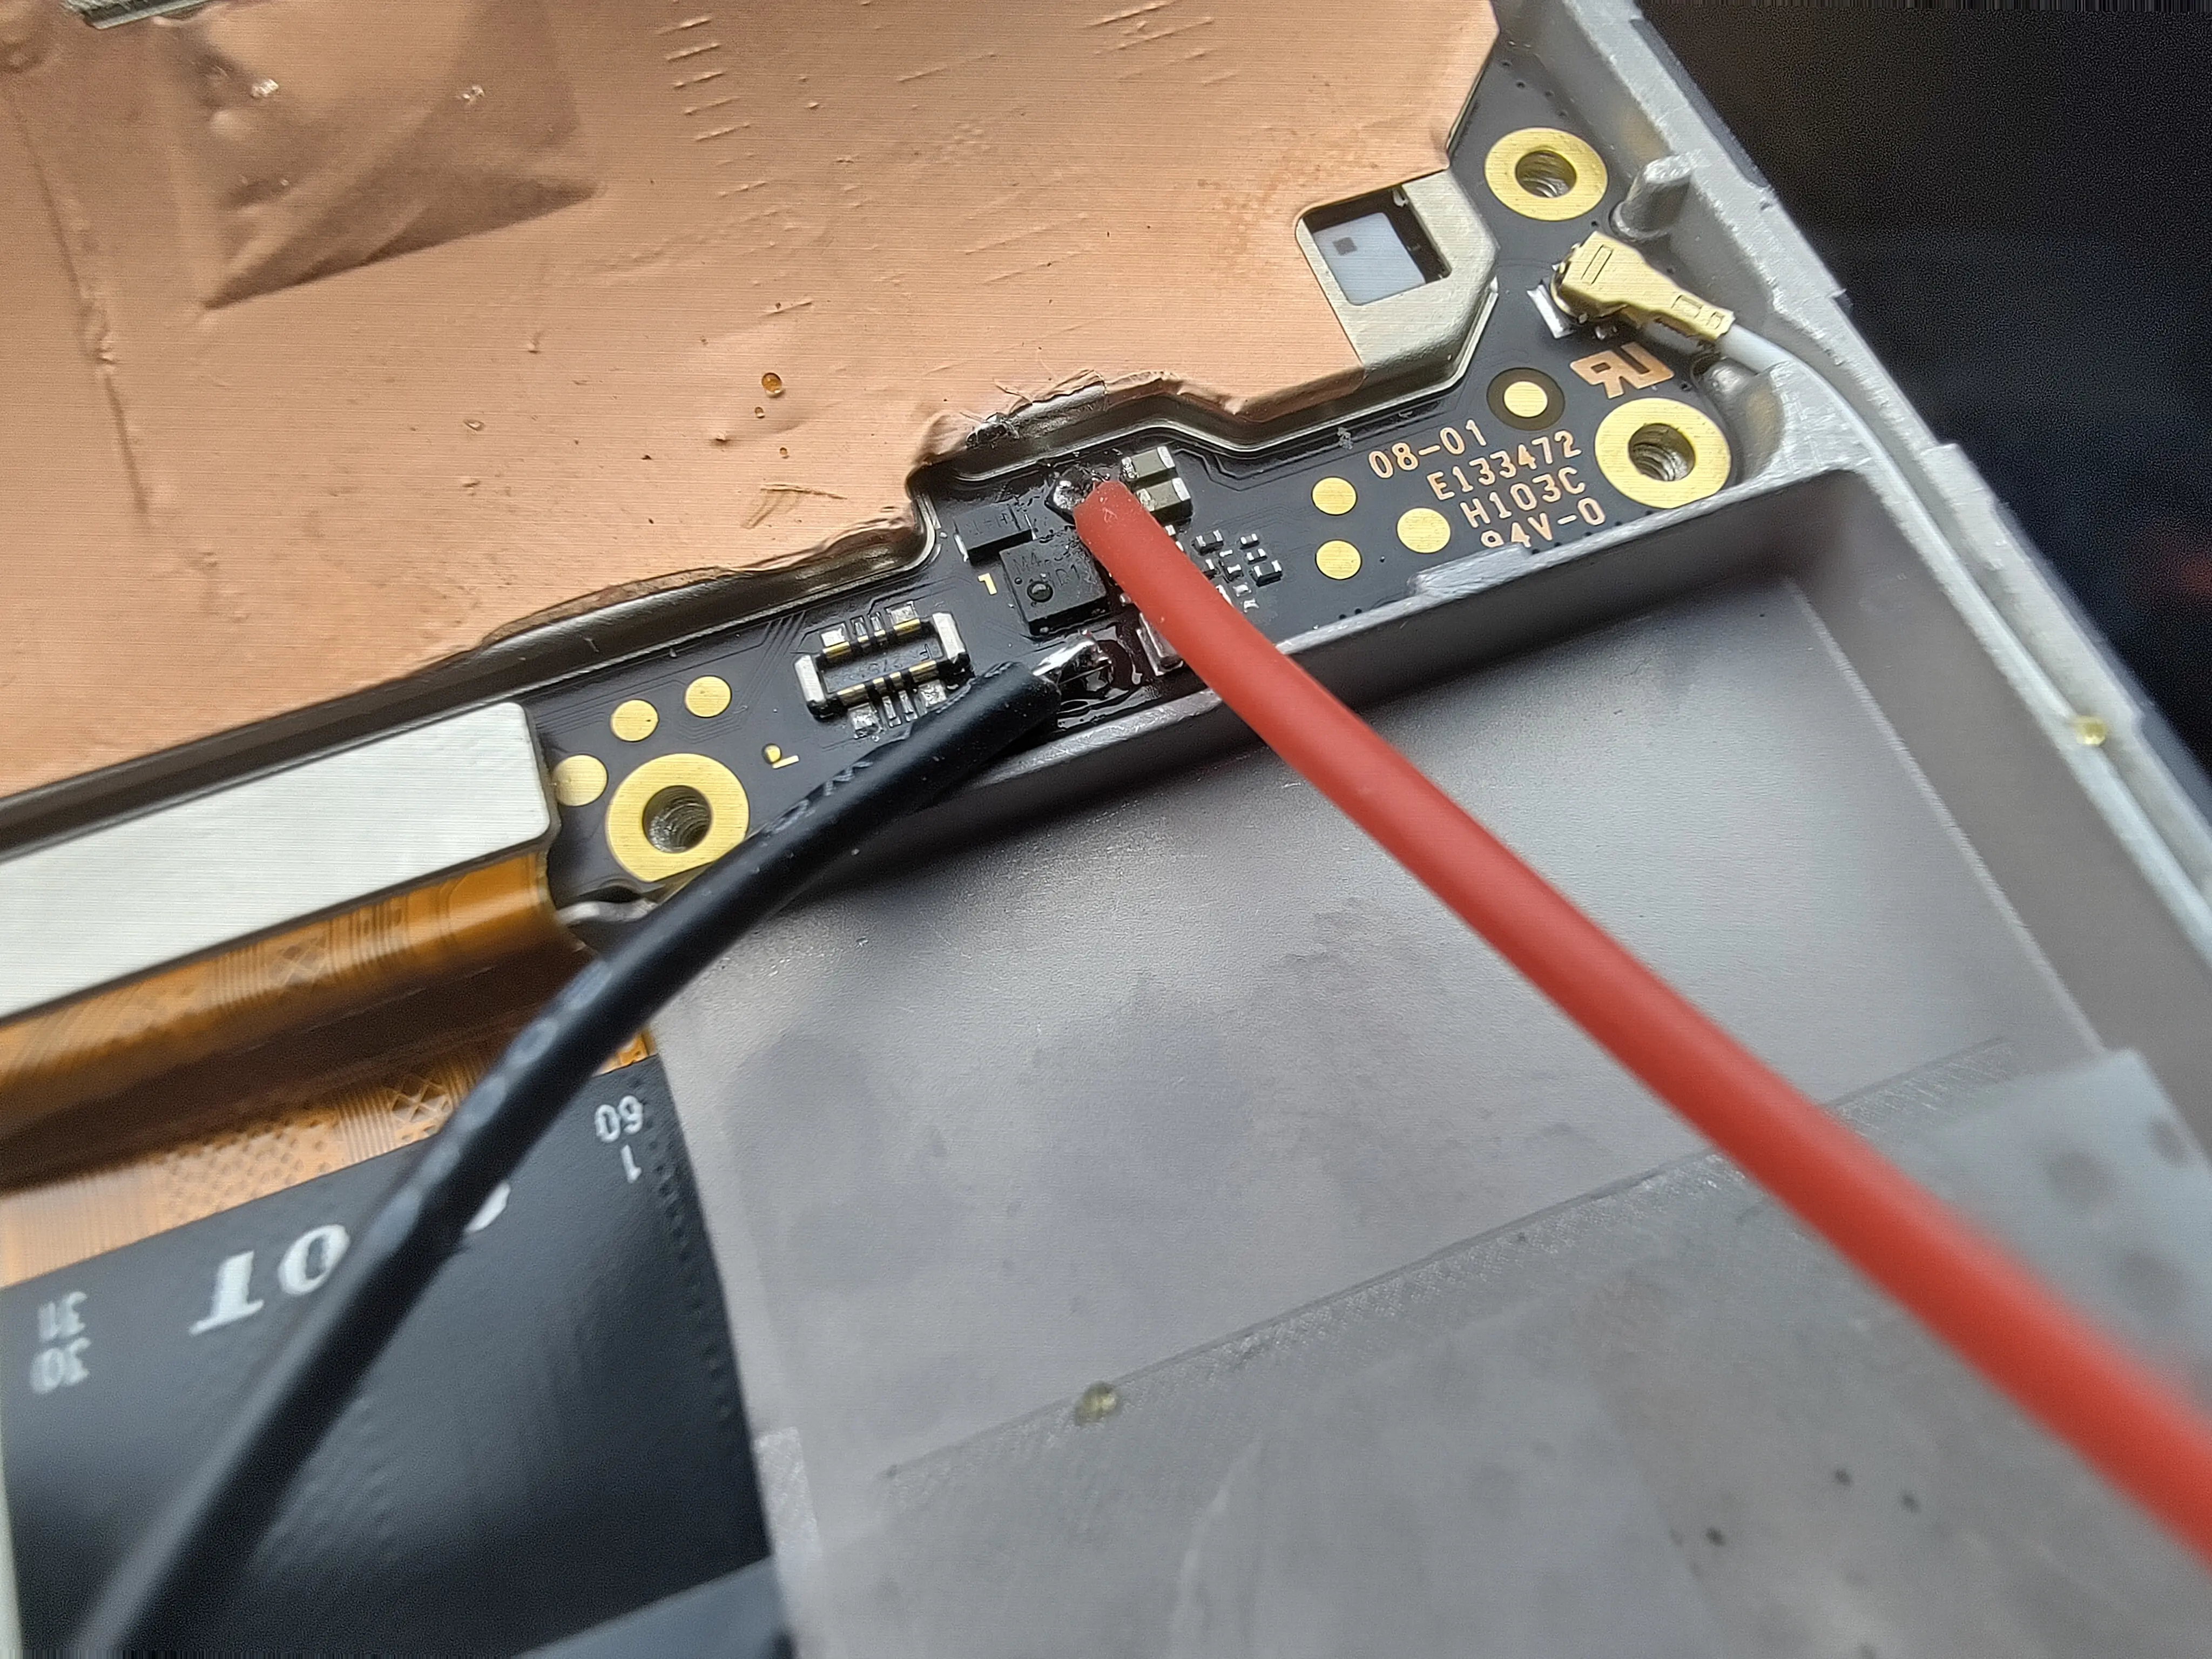
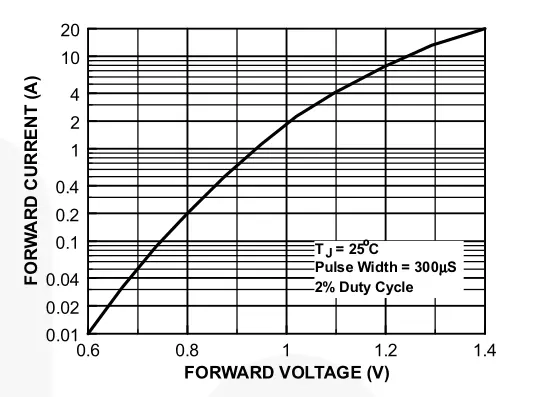
Accounting for some voltage drop resulting from the USB cable’s own resistance, I’ve opted for a 1N4007 signal diode, which provides an approx. ~0.6V voltage drop at very low currents (~10mA), and respectively ~1V at 2A (datasheet).
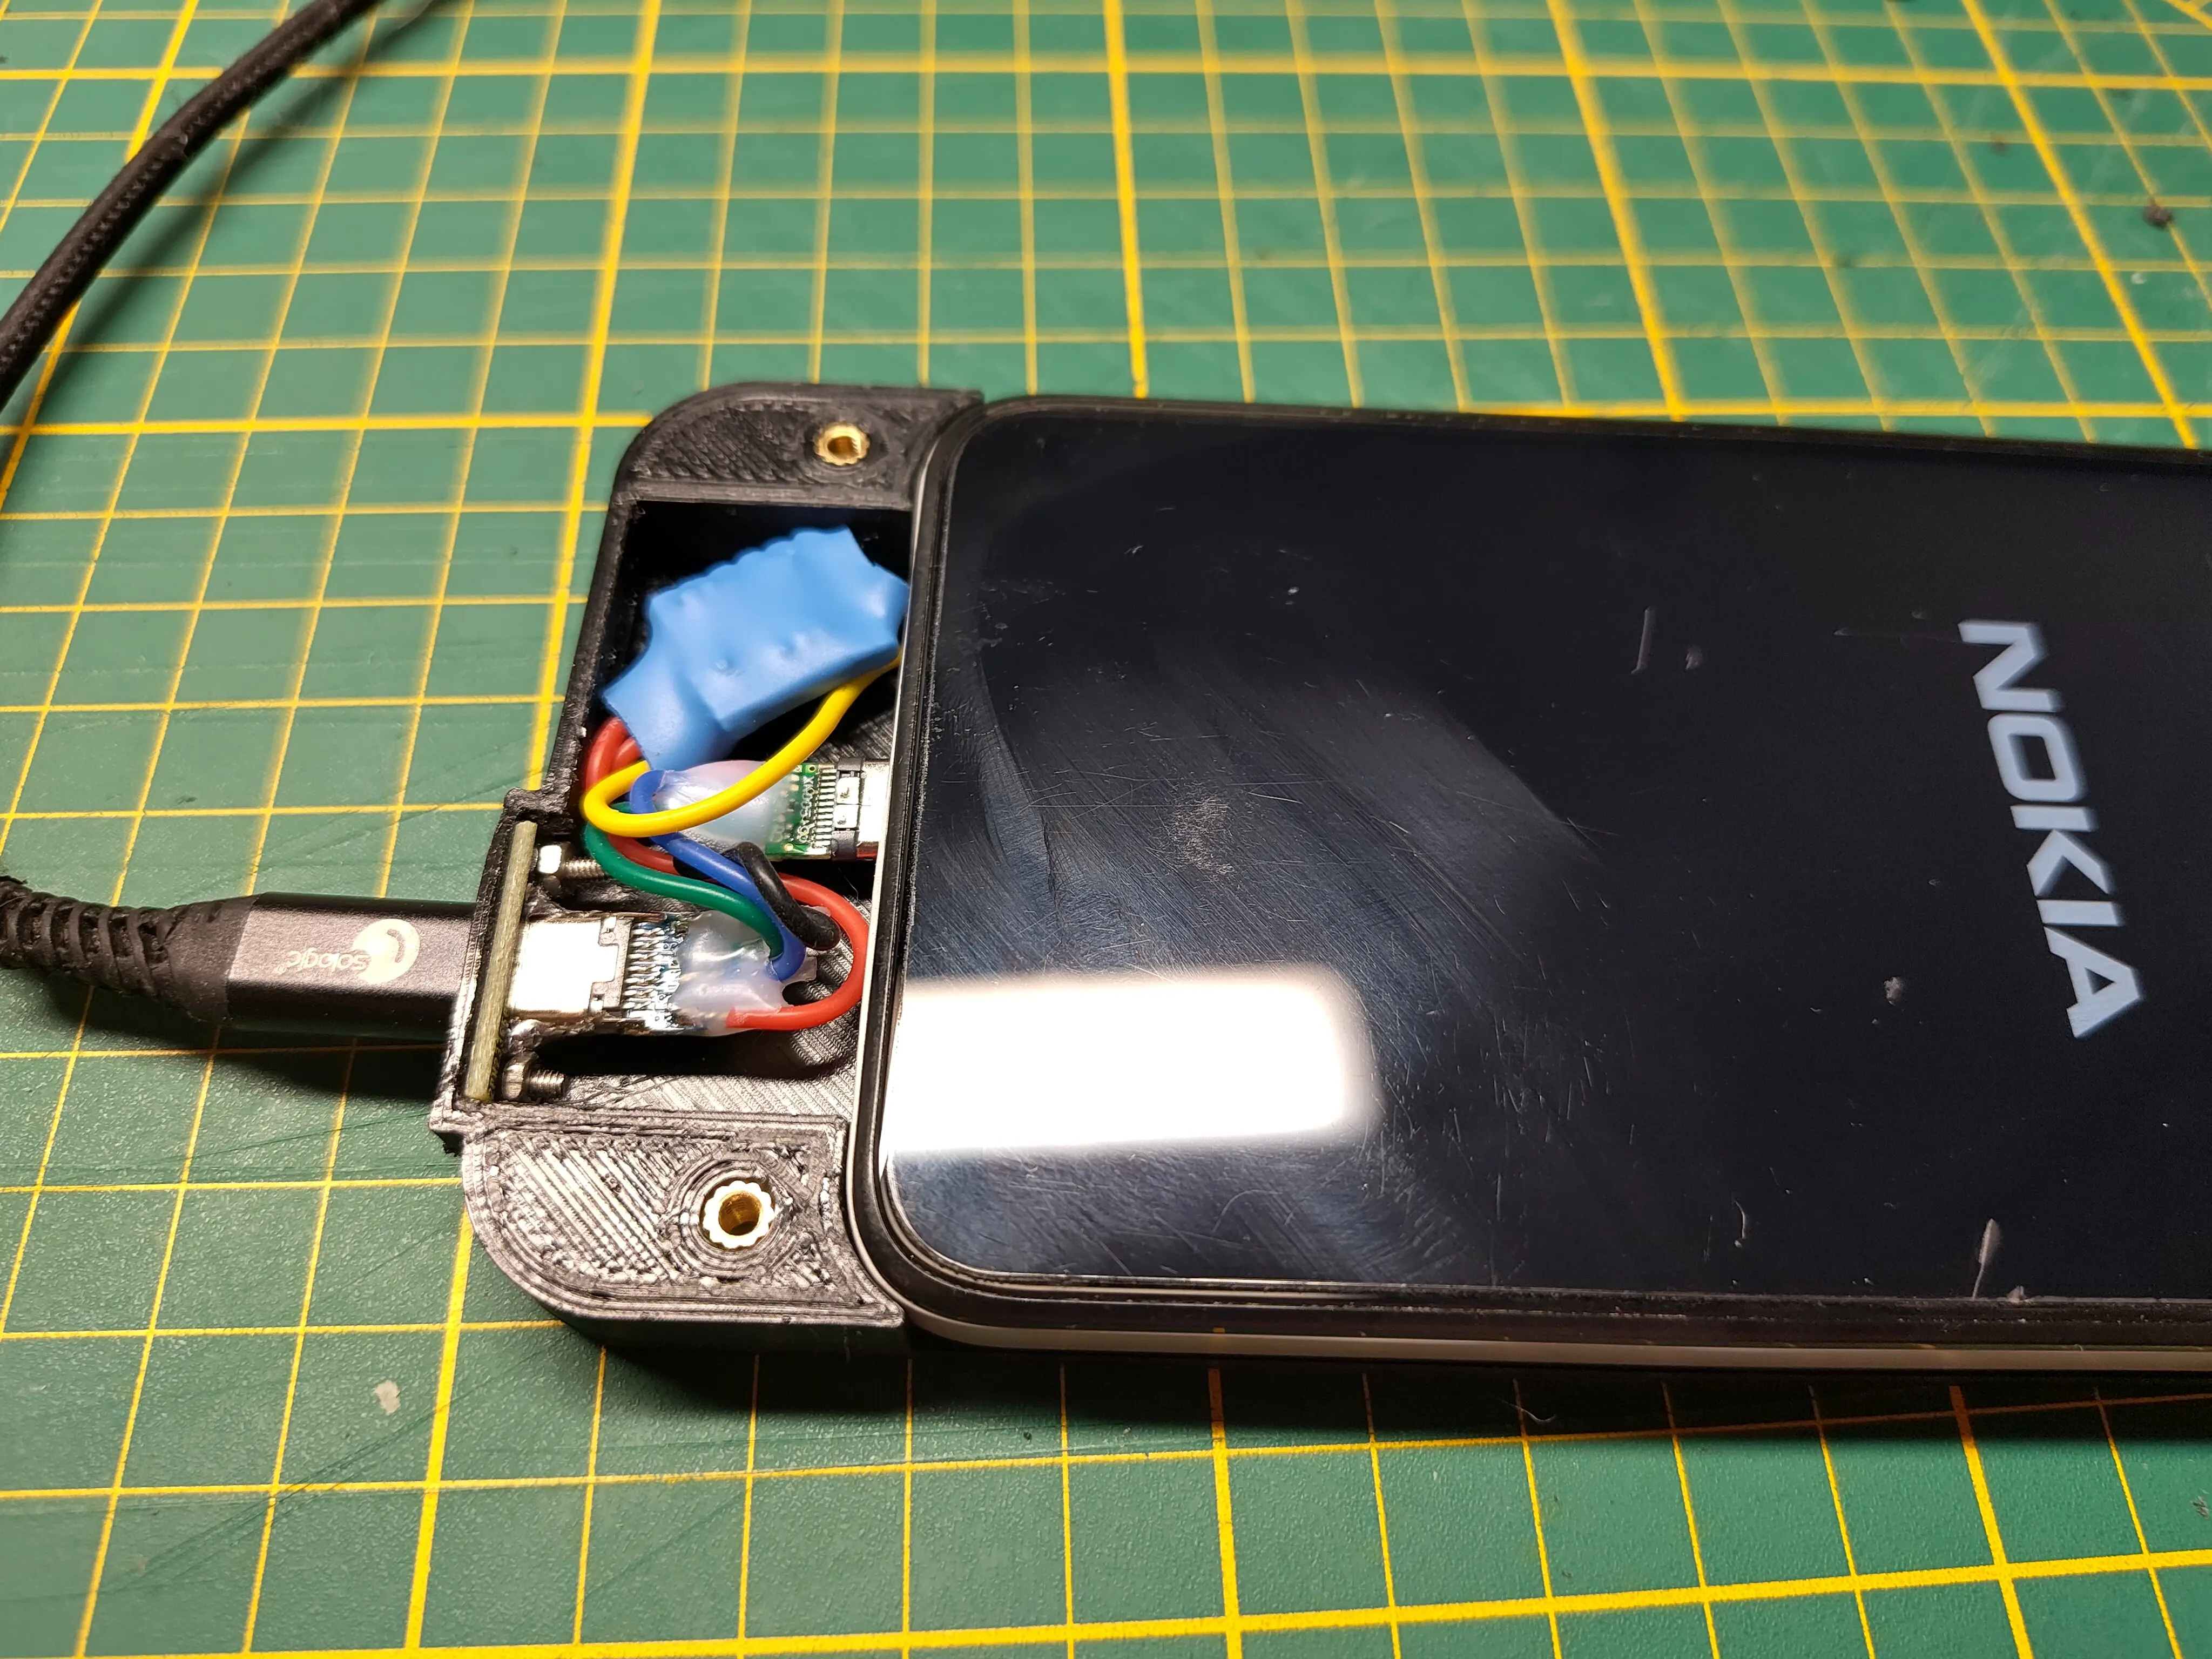
I wanted to power the final product using a single USB-C cable. To achieve that, I’ve used a USB-C receptacle and plug, allowing me to sidechain the supply voltage (VBUS) into the battery-mocking diode (D1). A USB charger would later connect to the circuit’s USB-C receptacle (J1), which would then supply voltage to the USB-C plug connected to the phone (P1), and the battery mocking diode (D1). The diode’s negative lead would connect to the battery supply voltage test pad (VBAT), completing the power supply circuit. USB data lines are passed through, so the resulting device can still be controlled via ADB in the future.

To be honest, I’m unsure how the on-board power management system uses the mocked battery. I could measure it, but I don’t care much about it, on the condition that the circuit operates safely. Hopefully, as long as it sees USB power – which is always, in this scenario – it will only use the mocked battery as a voltage reference, to determine whether it should begin a charging cycle. That way, voltage should be regulated more efficiently, by the on-board switching regulators. Conversely, should the majority of current flow through the diode (mocked battery), a non-negligible amount of the energy would inadvertently be converted into heat. And finally, the mocked battery certainly cannot be “charged”, in the sense of a reverse current flow, due to the semiconducting nature of the diode.
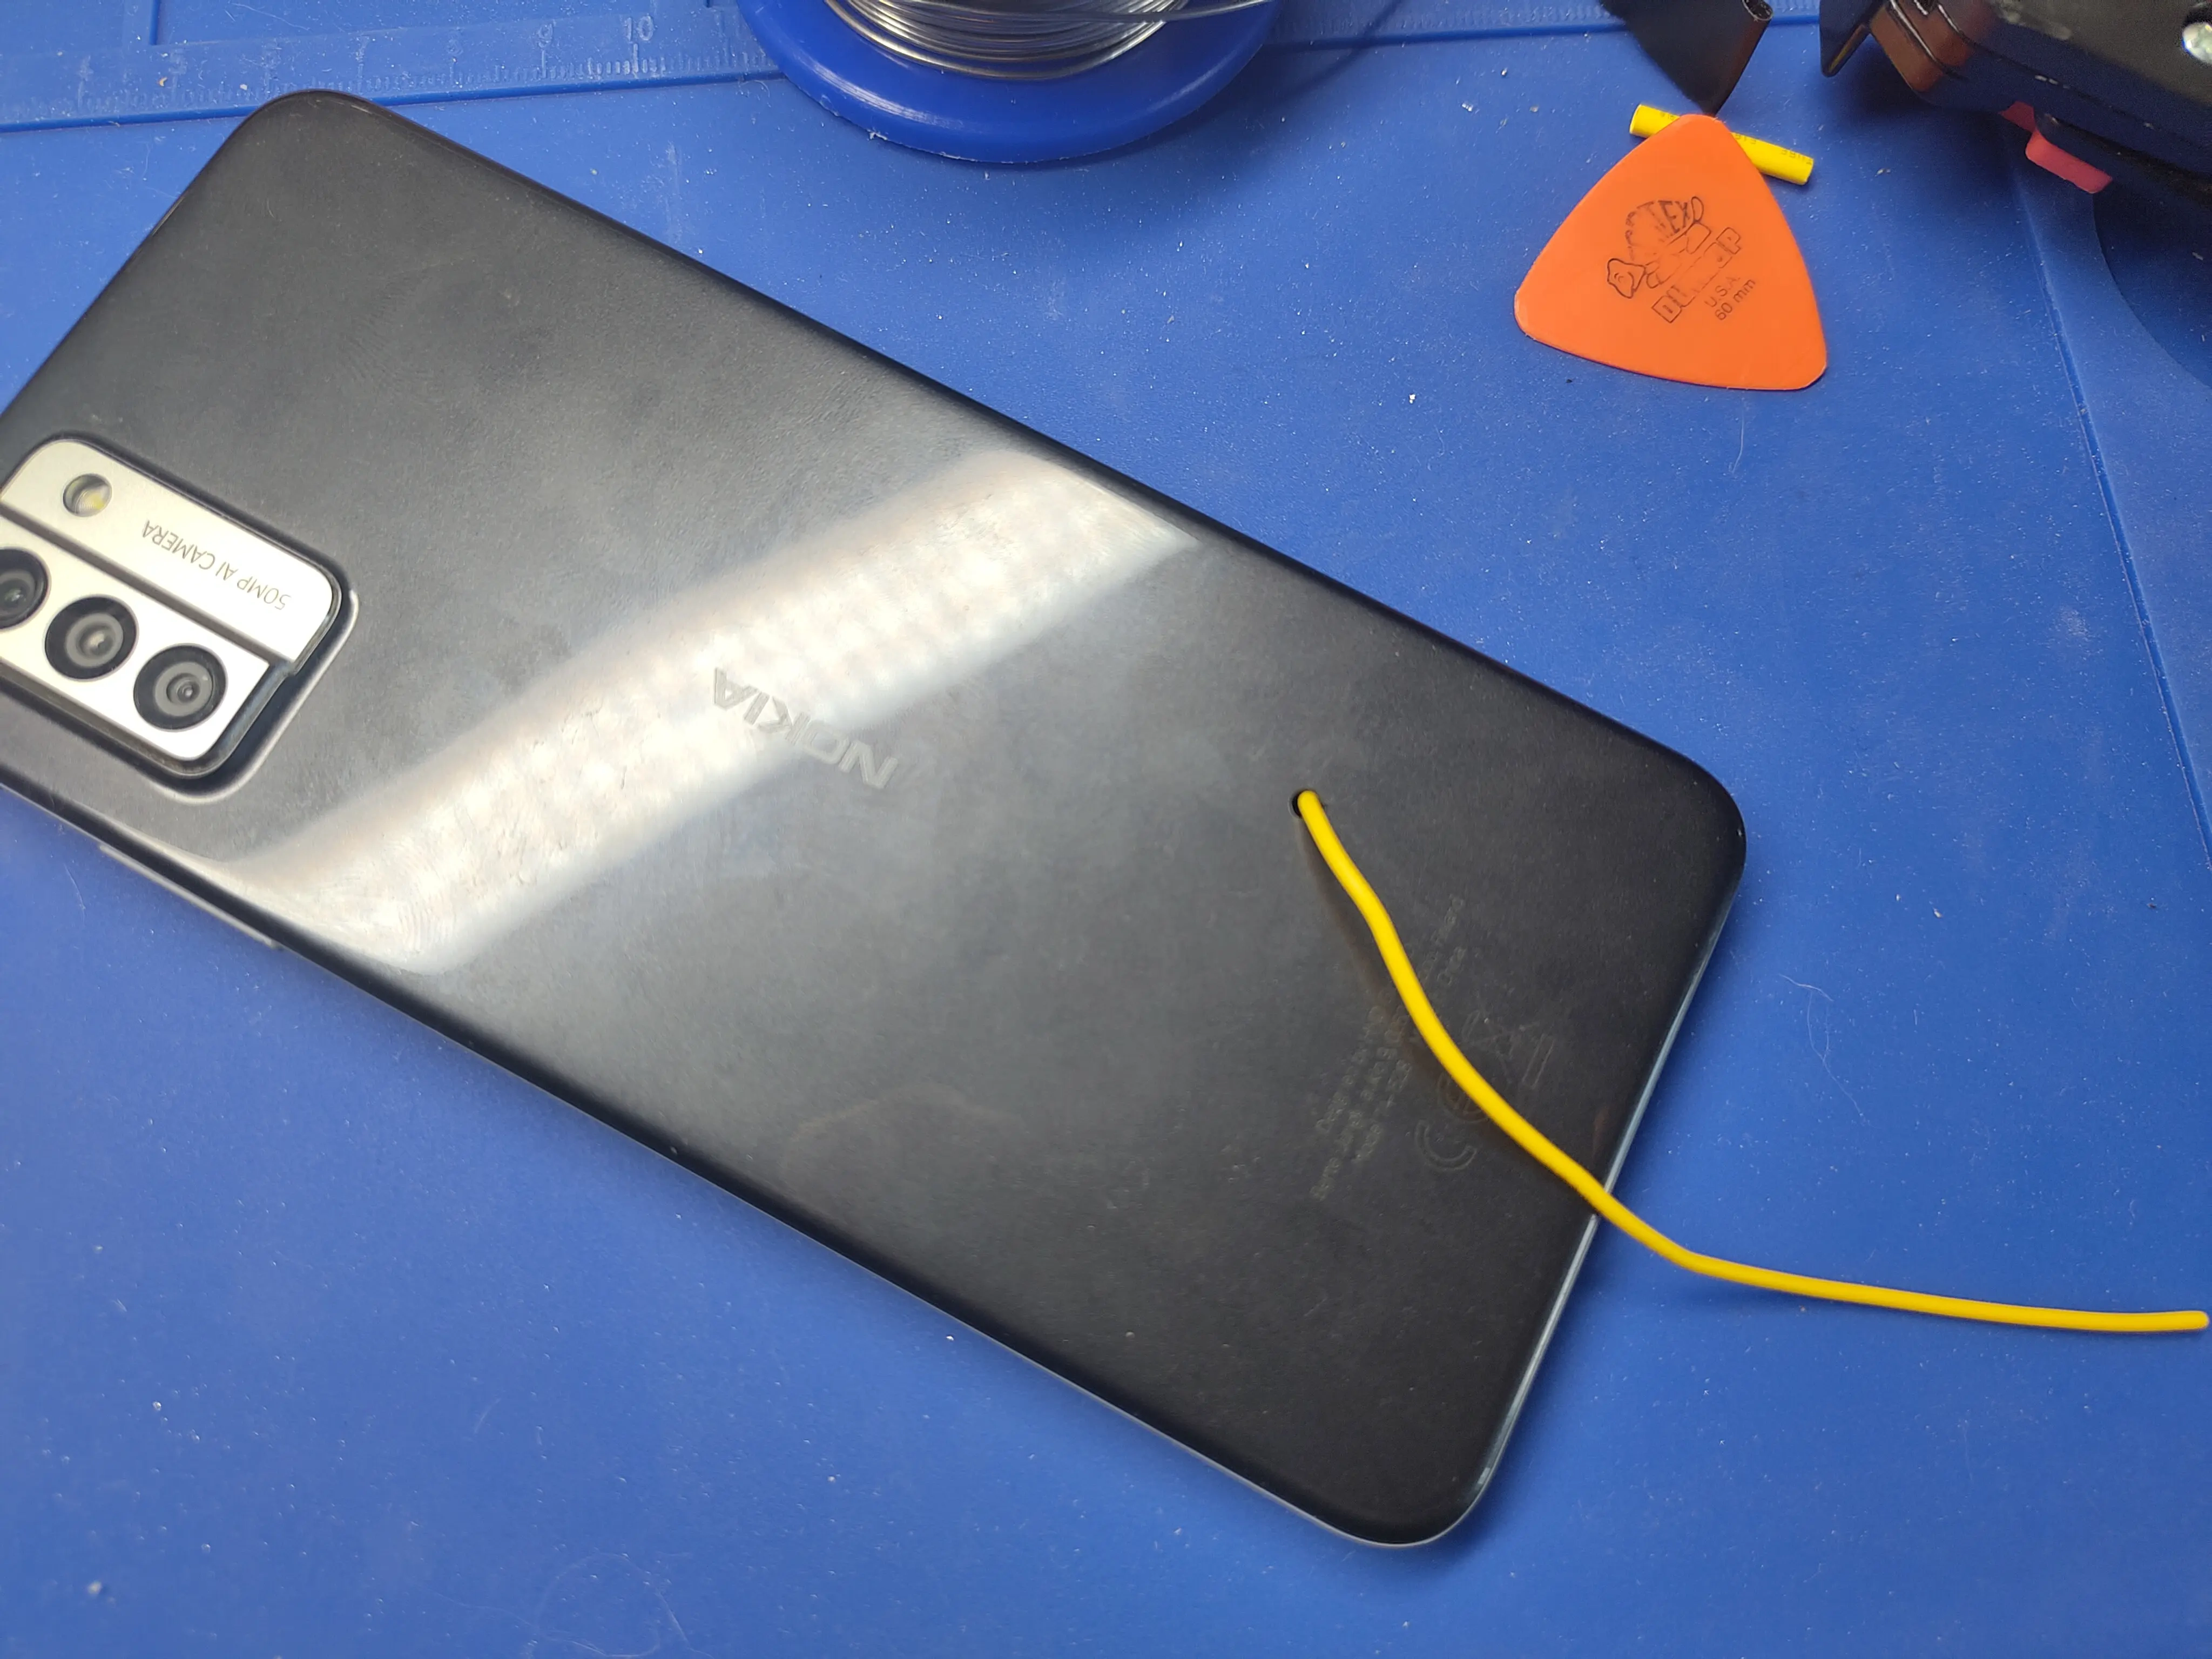
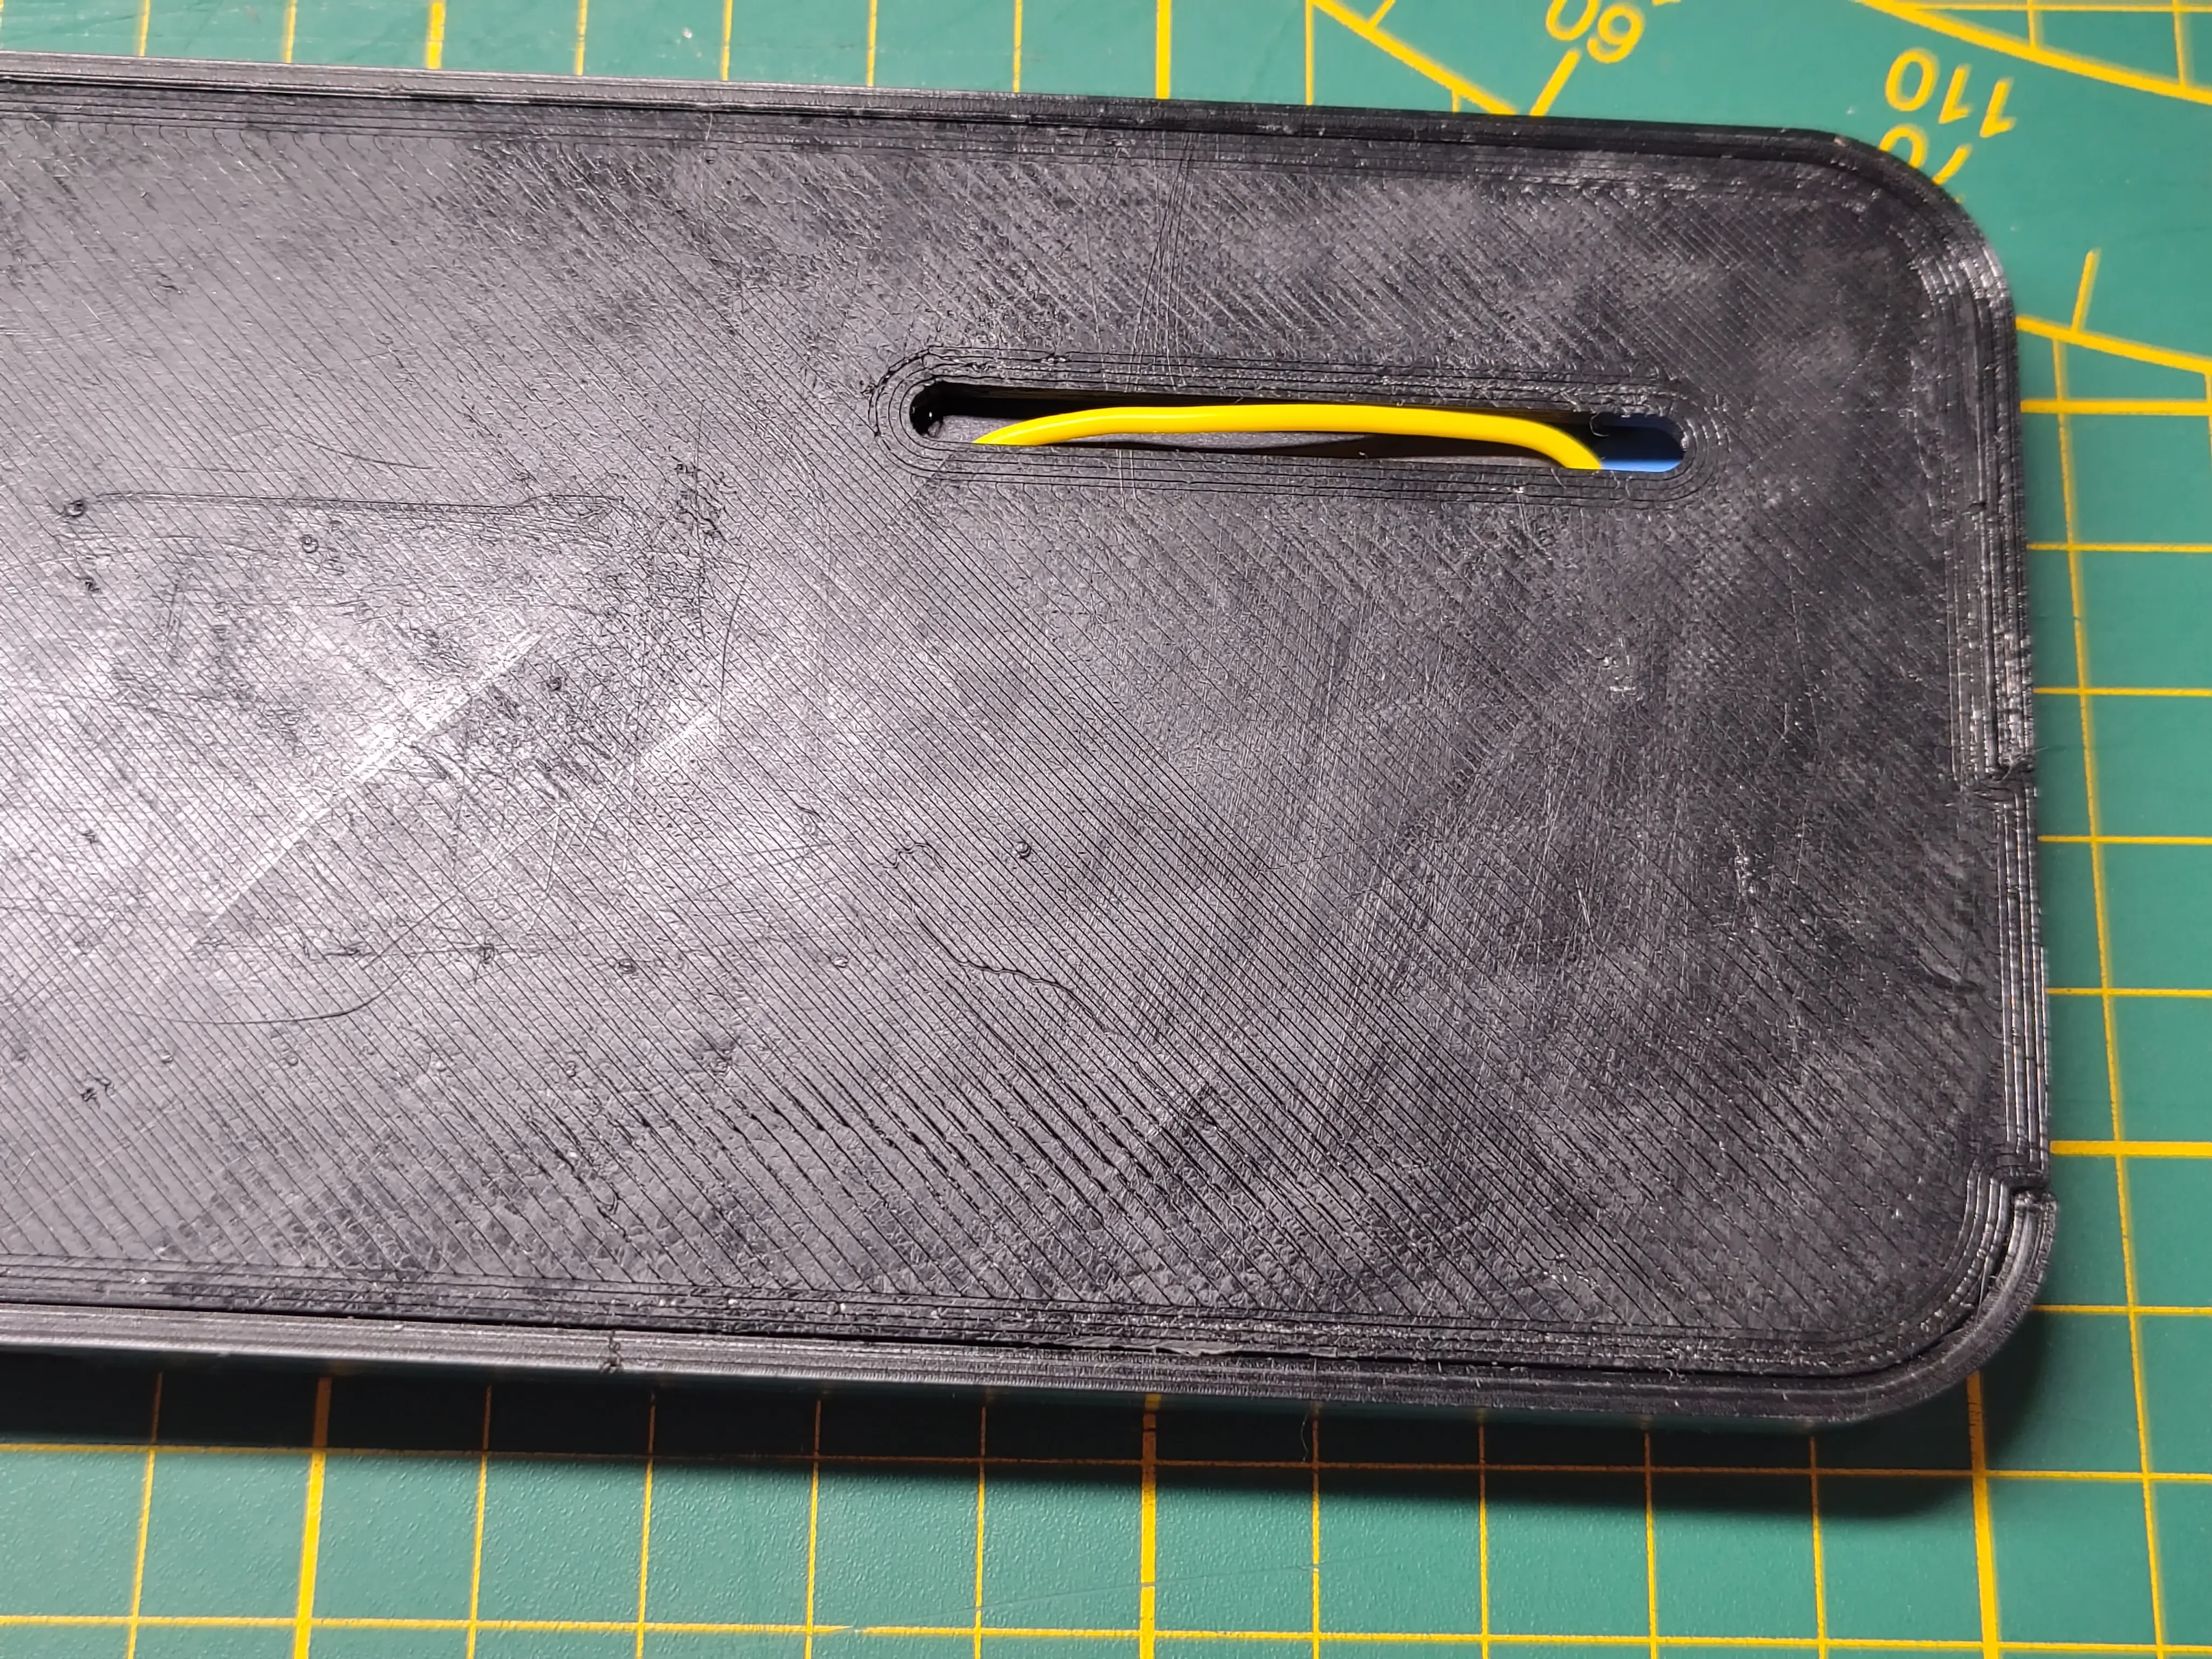
I’ve drilled a small 2mm hole in the phone’s back cover to route the VBAT cable out from the motherboard.
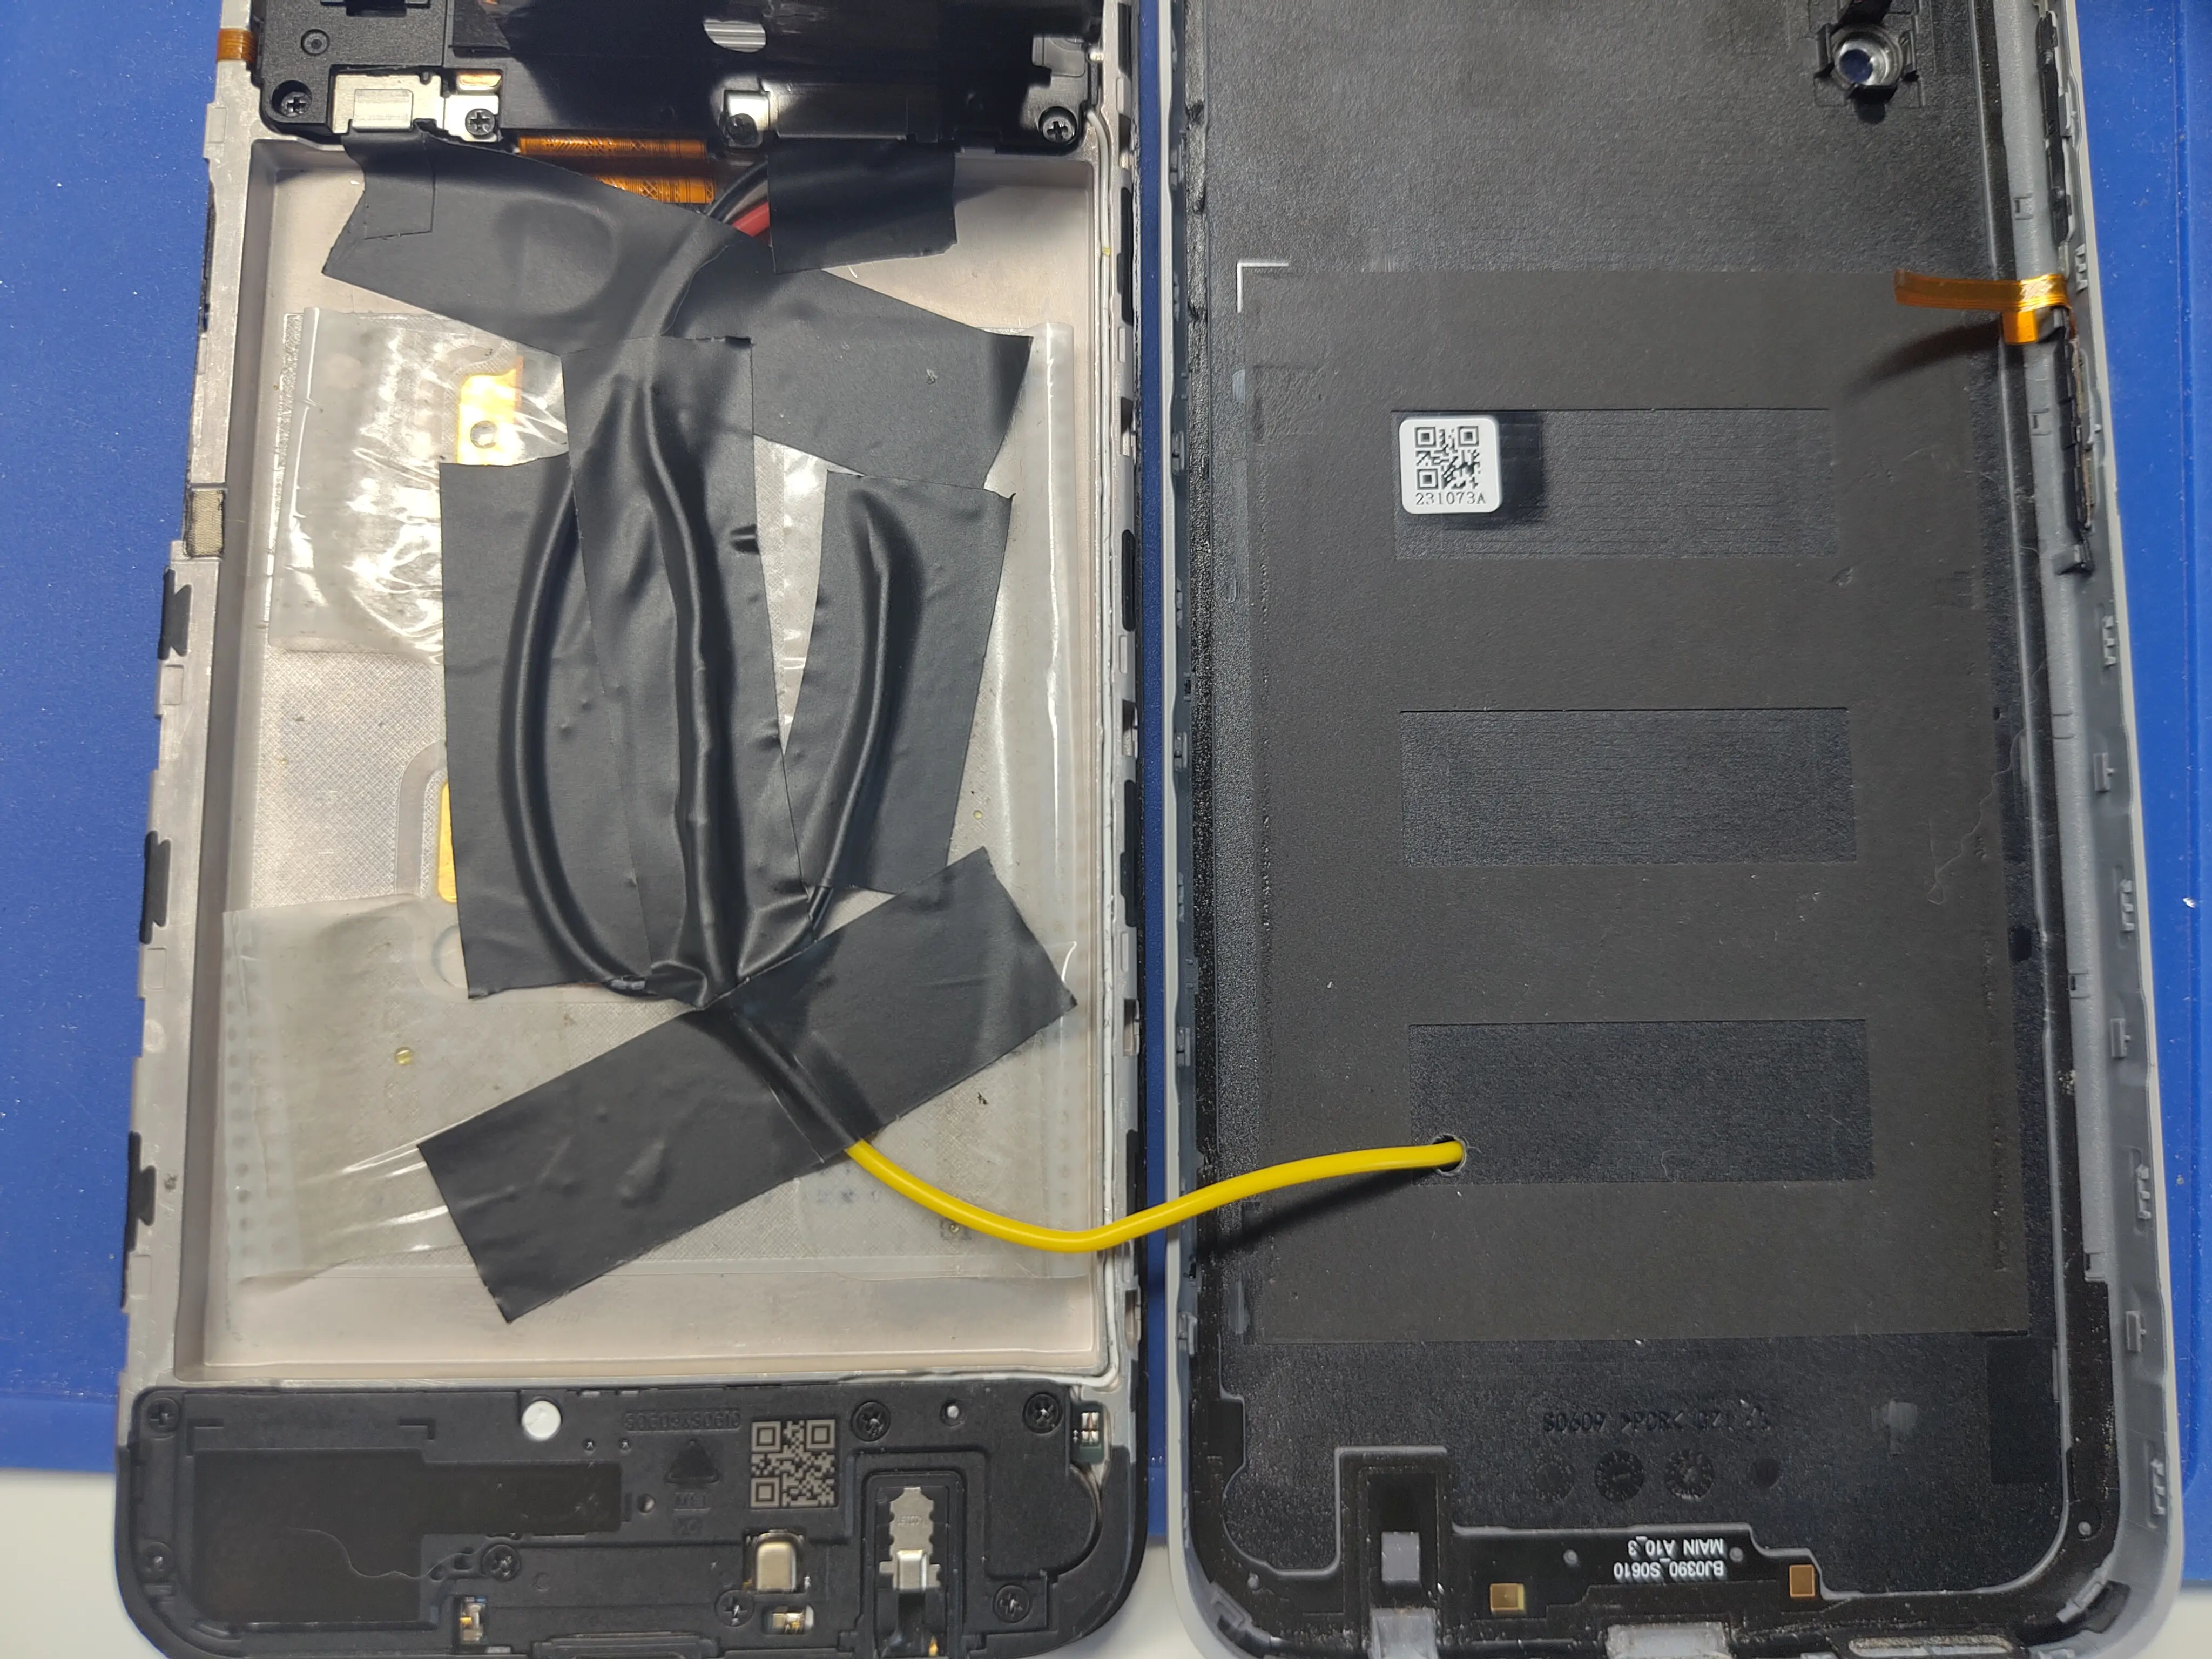
I’ve soldered the circuit on the tiniest universal PCB ever, and applied hot snot on the wires, to relieve potential strain on the solder joints.
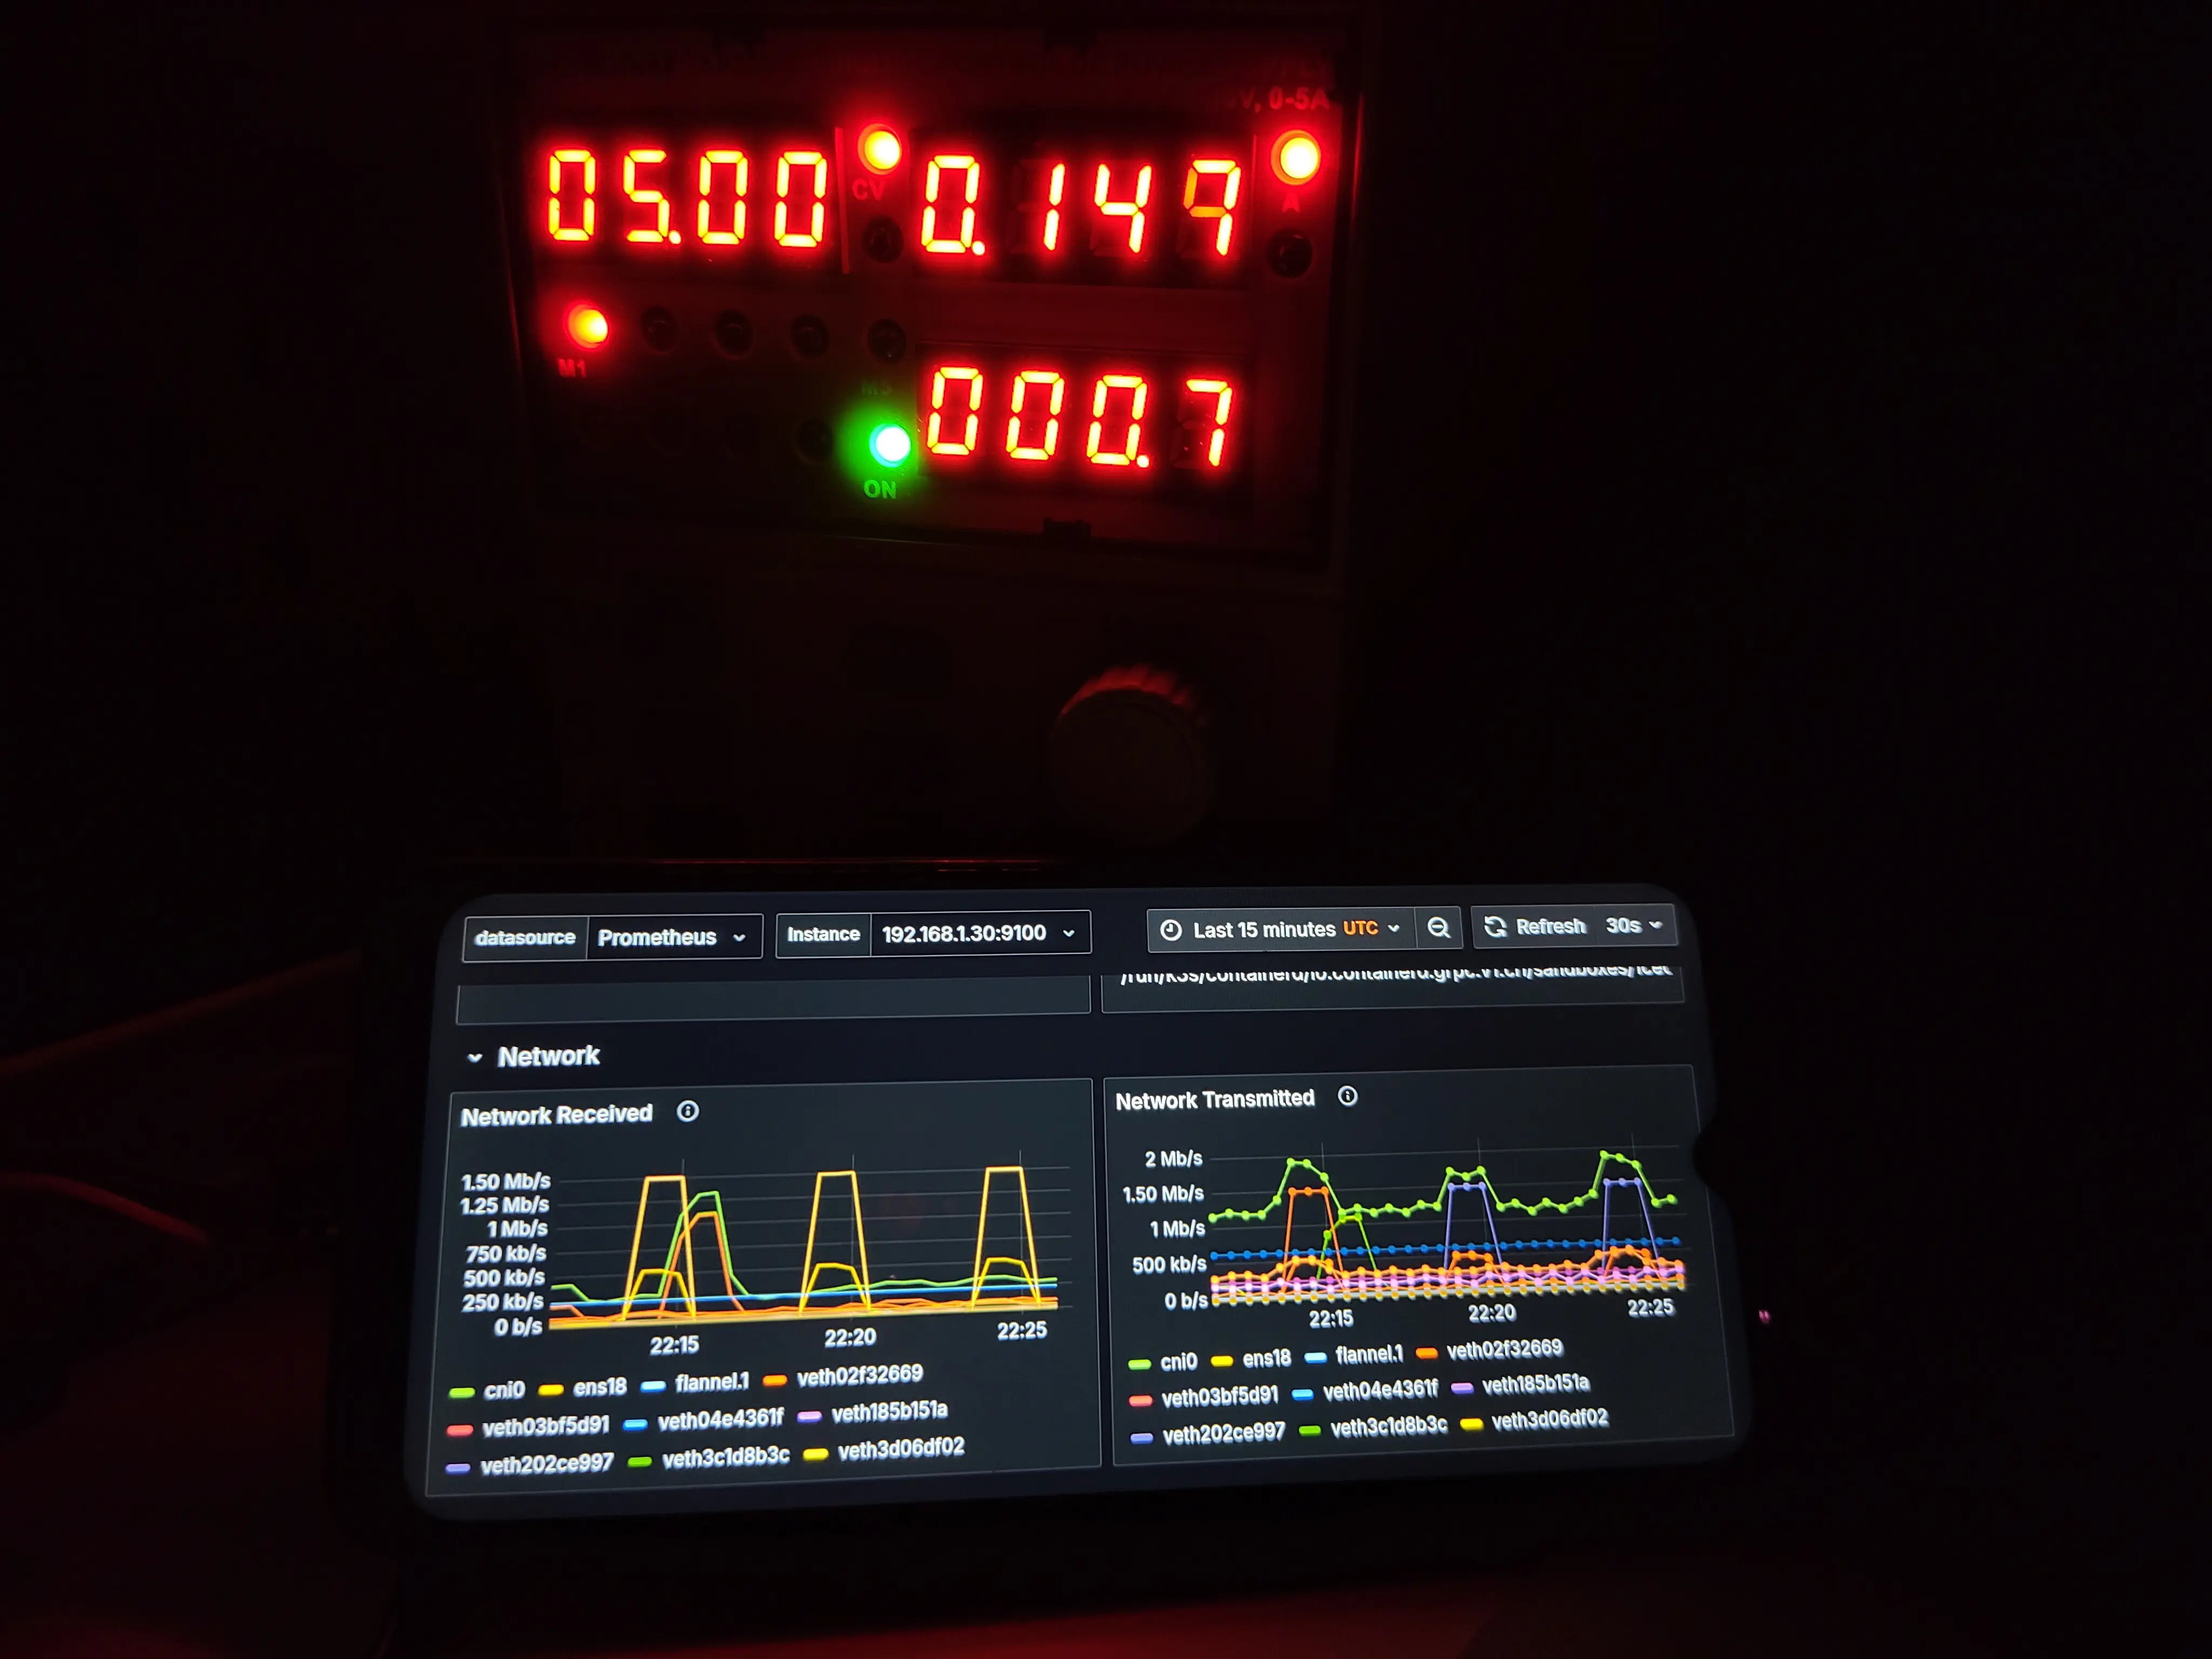
At this point I did some ballpark measurements using my bench PSU, providing a supply voltage of 5V. These values of course are greatly influenced by the phone’s configuration, enabled peripherals, and the workload. The biggest contributing factor was without doubt the screen brightness (when not in sleep mode).
| Mode of operation | Power (approx.) |
|---|---|
| Boot | 2.0-5.0W |
| Idle, screen off | 0.5W |
| Grafana loading in Firefox, screen on, 30% brightness | 1.5W |
| Grafana loaded in Firefox, screen on, 30% brightness | 0.7W |
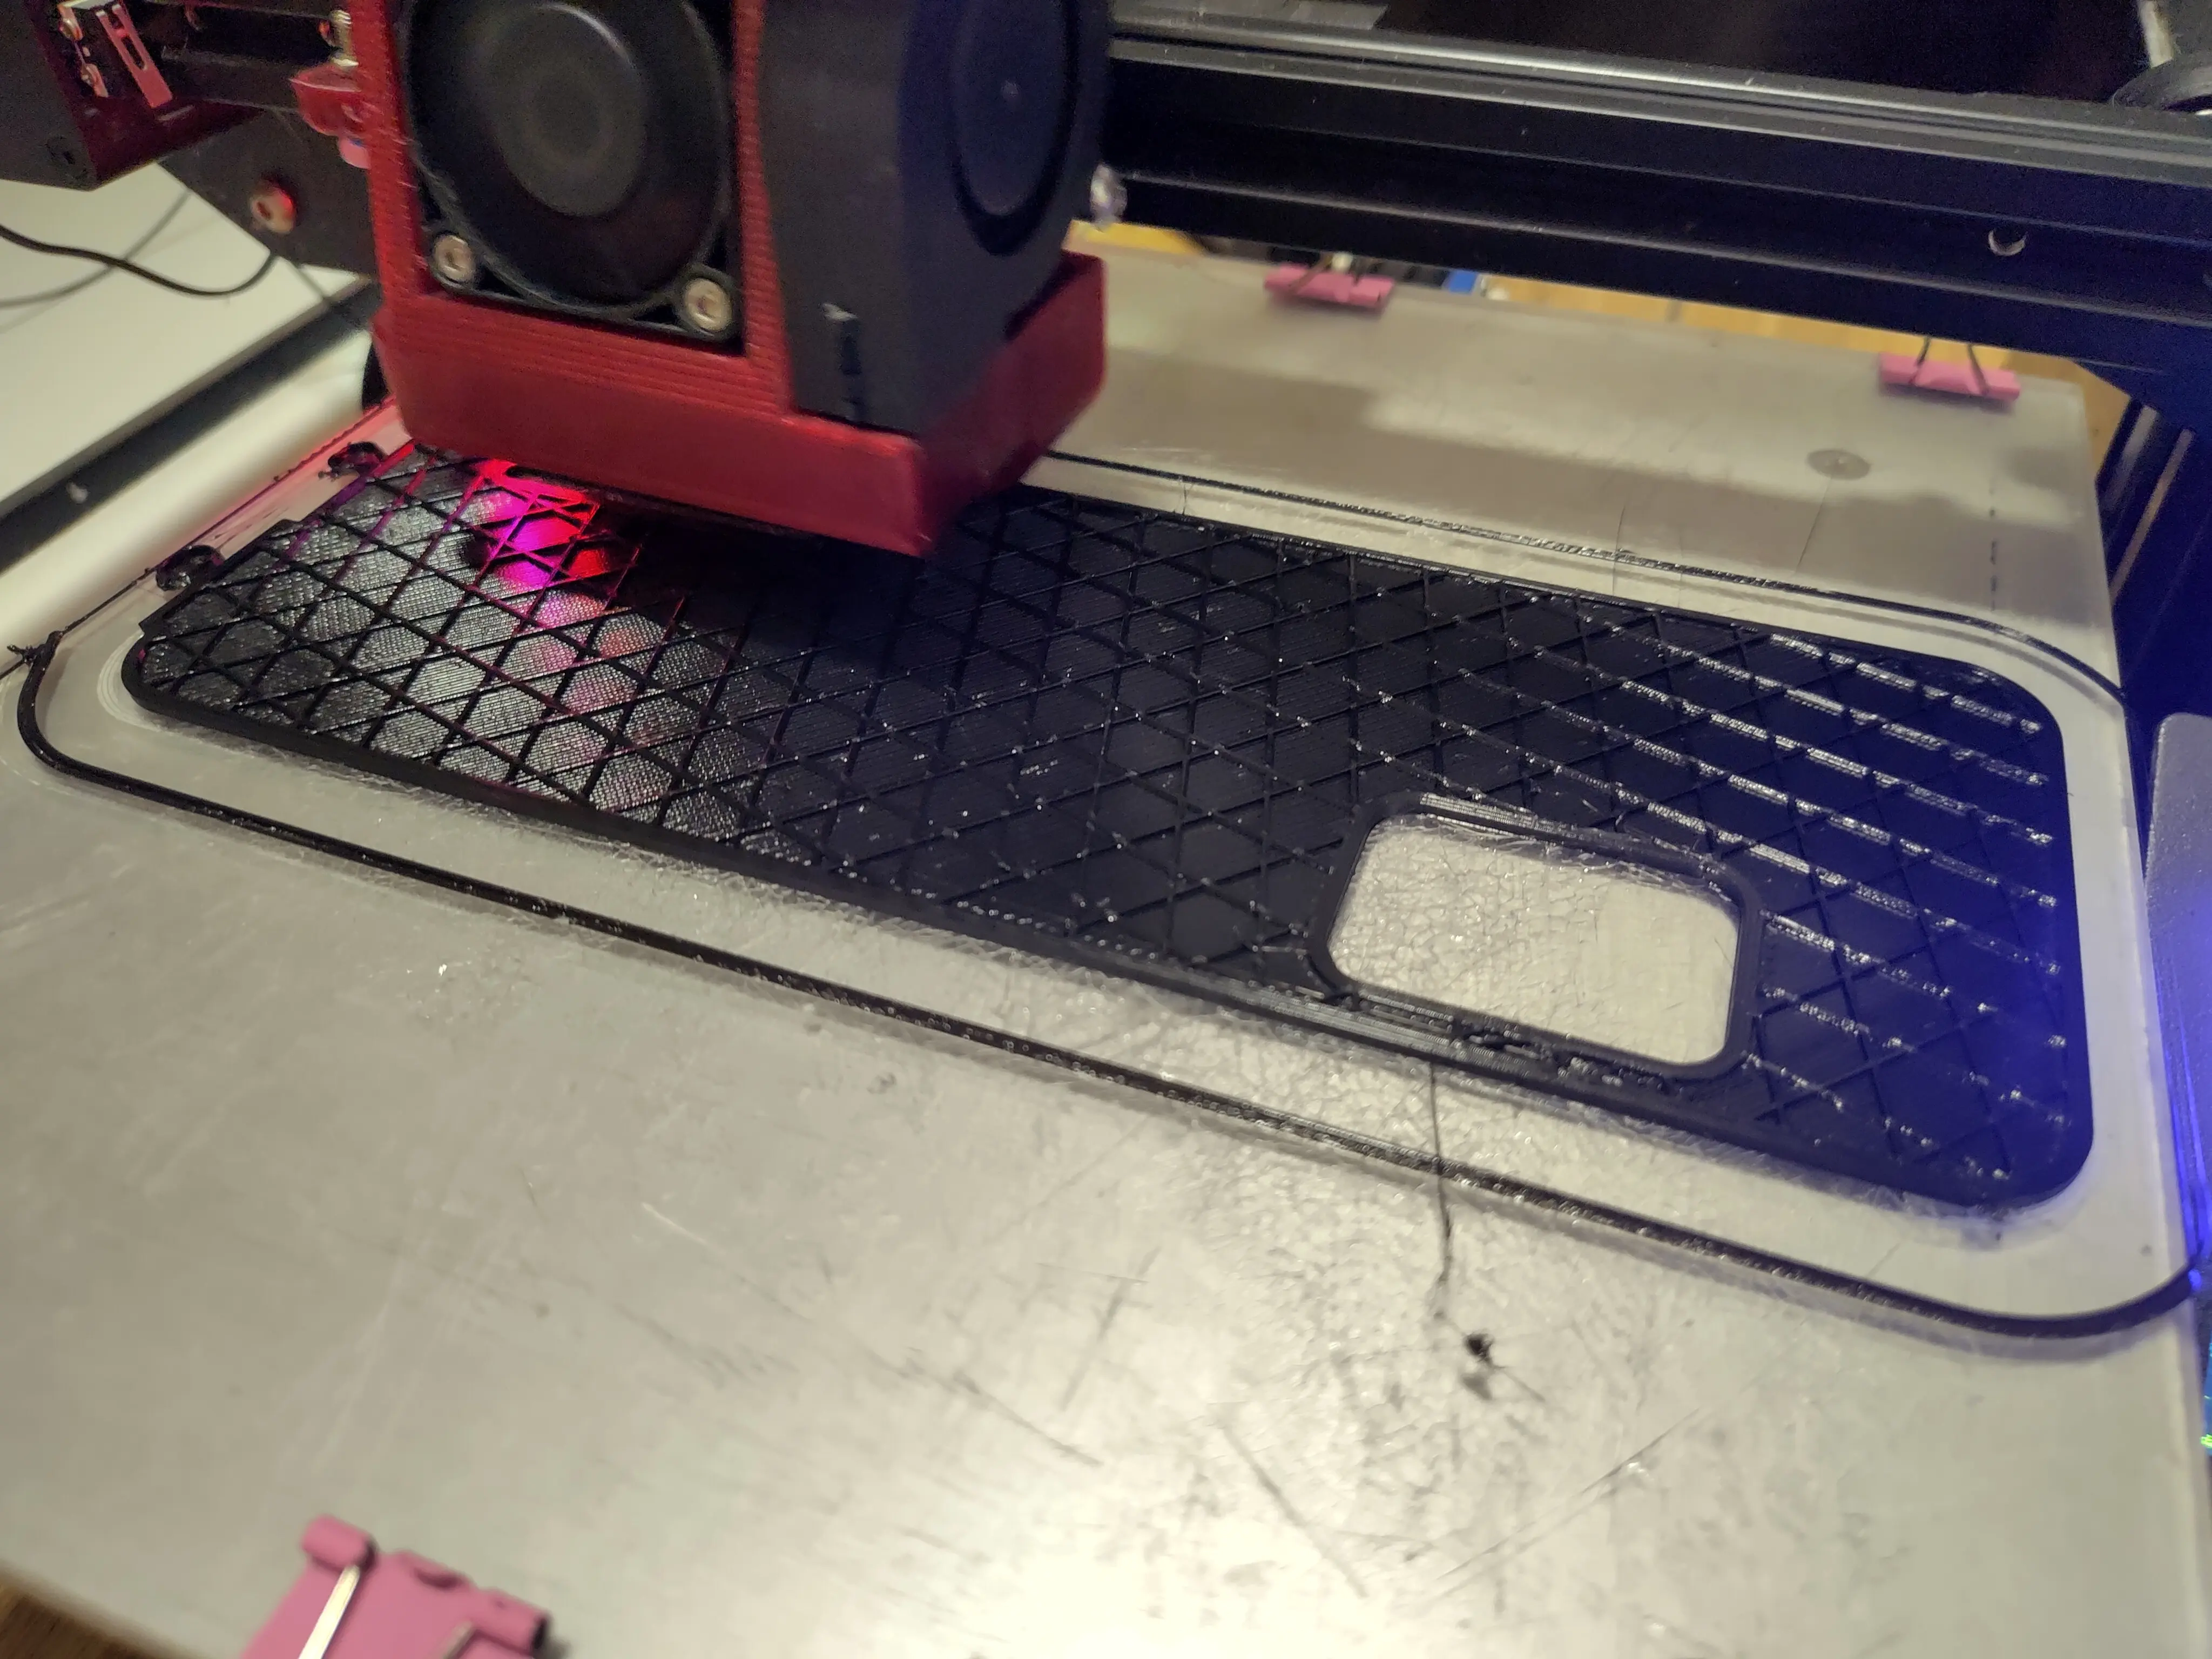
Enclosure
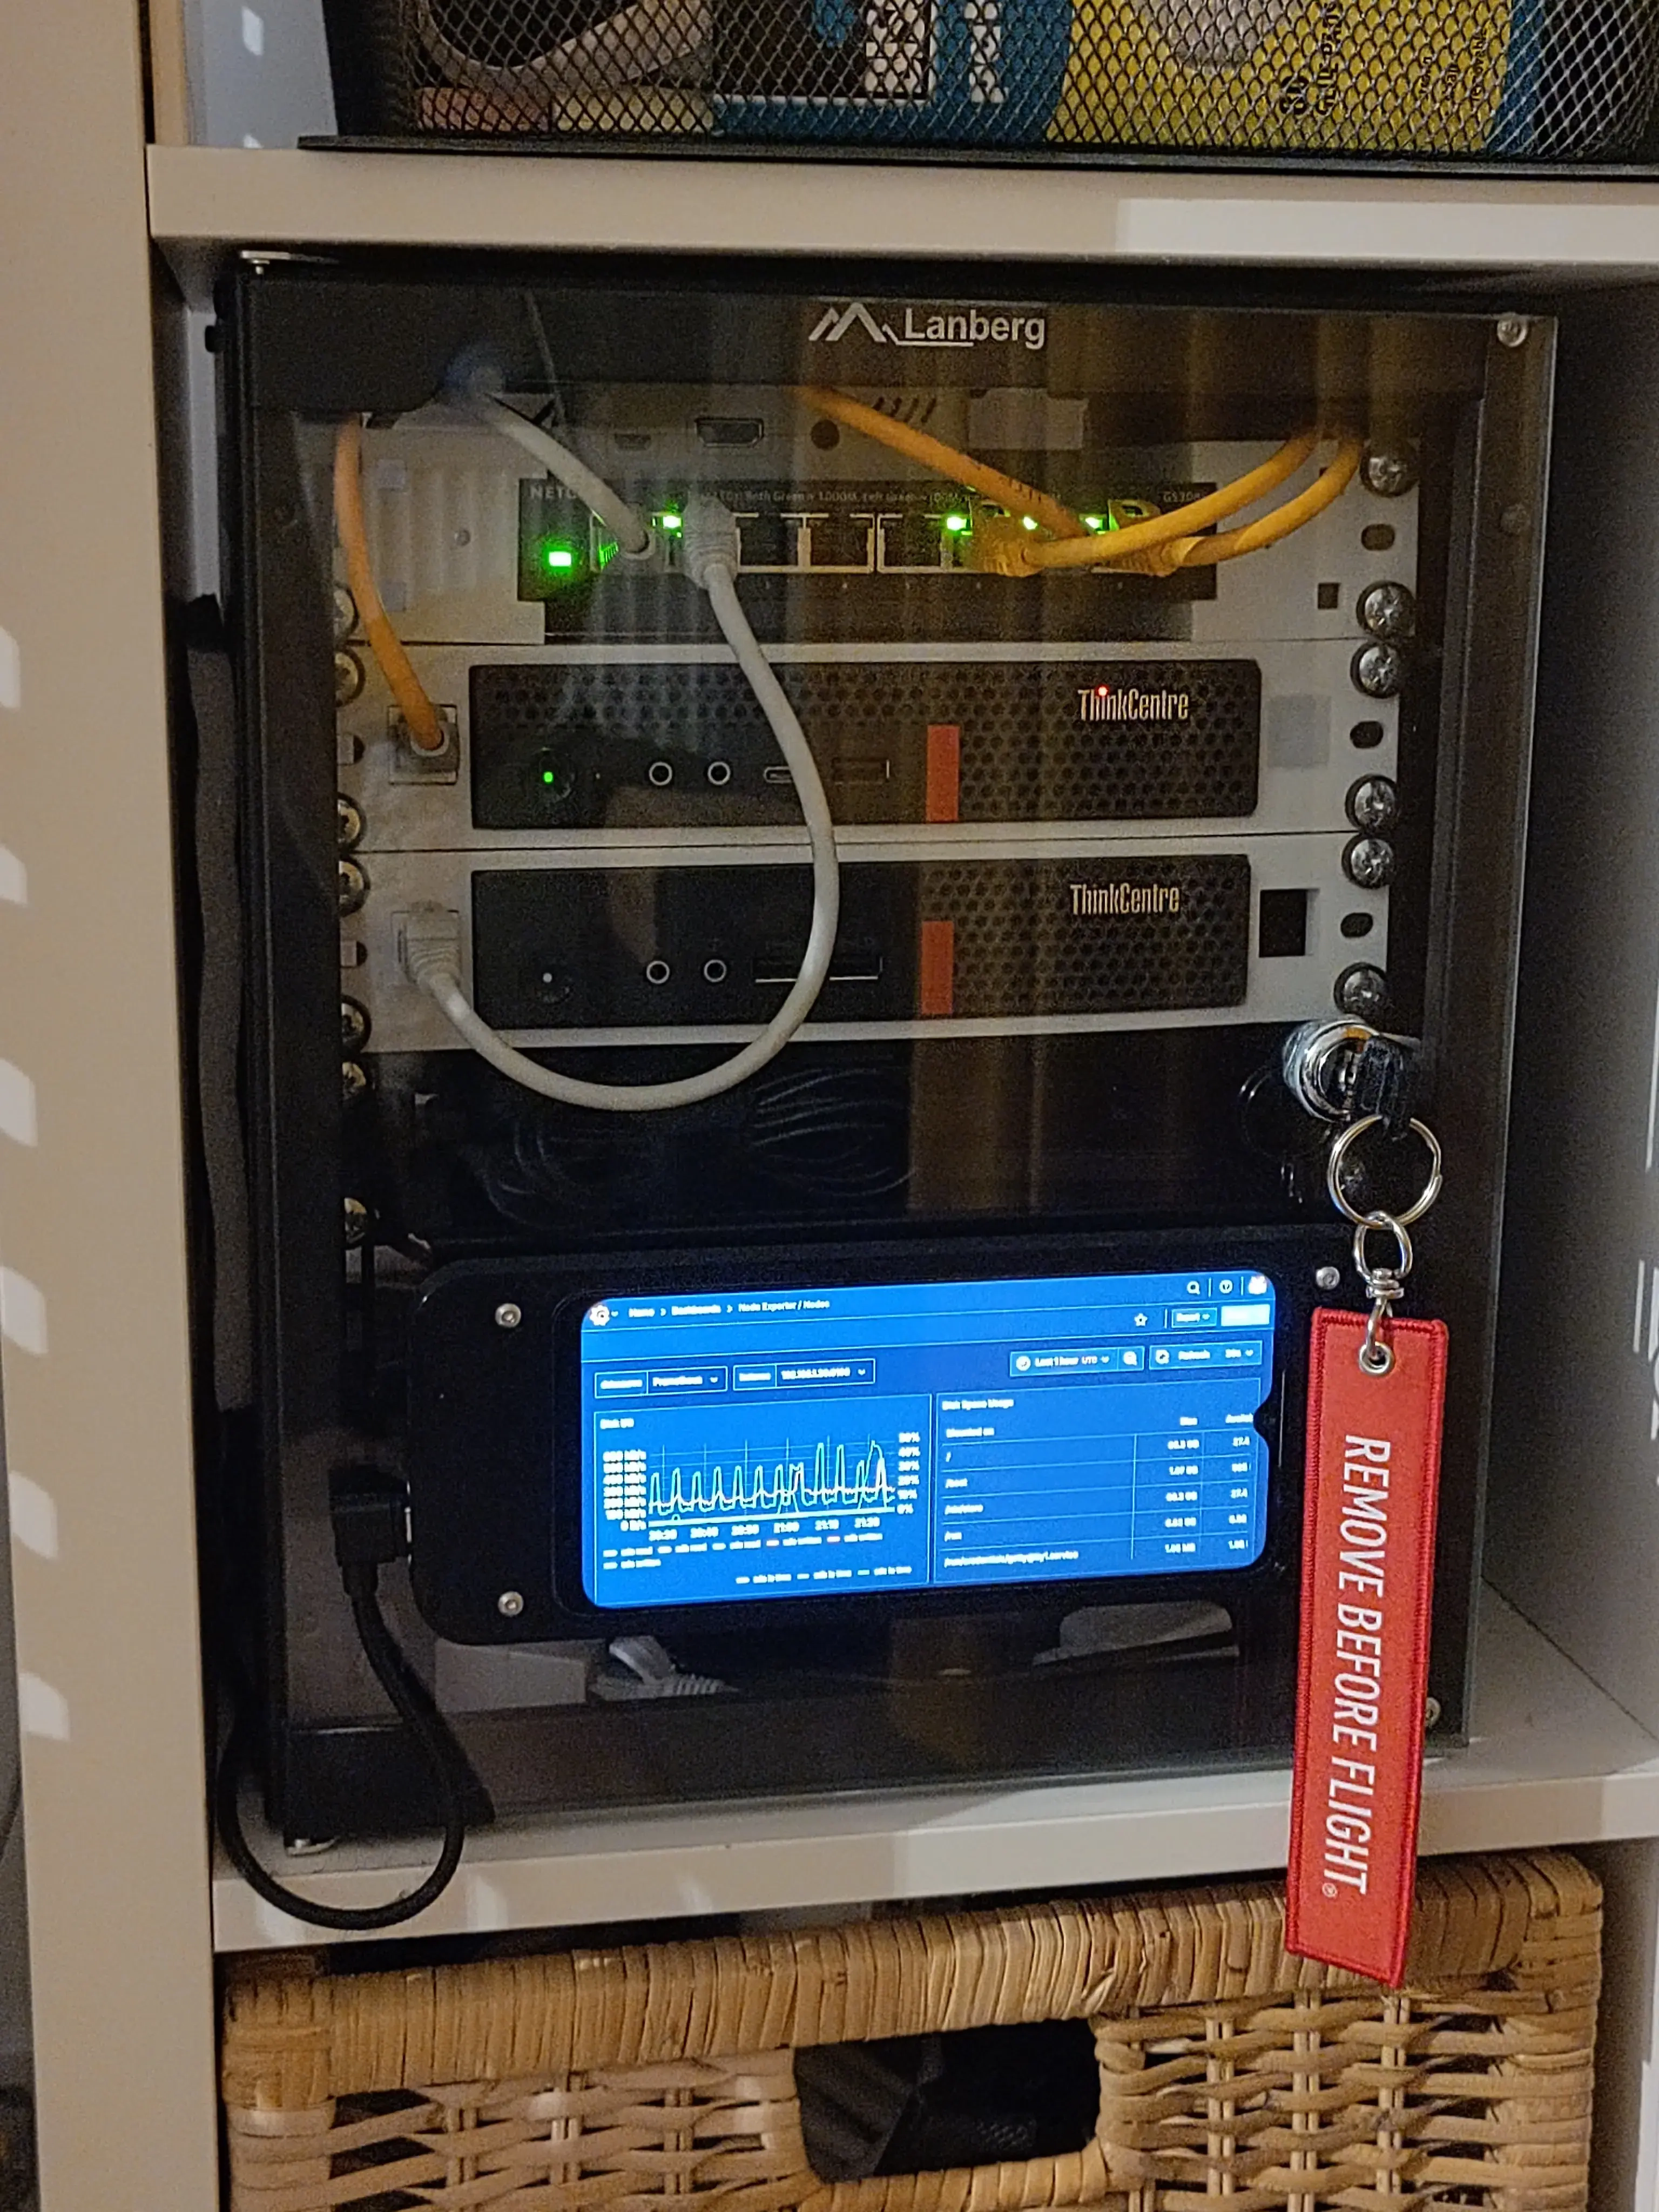
I wanted the mechanical design to be neat and minimalistic, while preserving the phone’s full functionality. When the phone’s screen was off, it would blend in seamlessly with the surrounding enclosure and server rack, thanks to the color-matched filament (black, heh).
I planned to mount the dashboard on the external side of my server rack’s glass door, providing easy access to the touchscreen, whenever the door is closed. As you’ve seen above, weight was not a concern, so I figured I’d attach the dashboard to the glass surface with either double-sided tape or velcro – the latter being more forgiving in terms of internal access and repositioning. Both could be easily removed, should I change my mind.
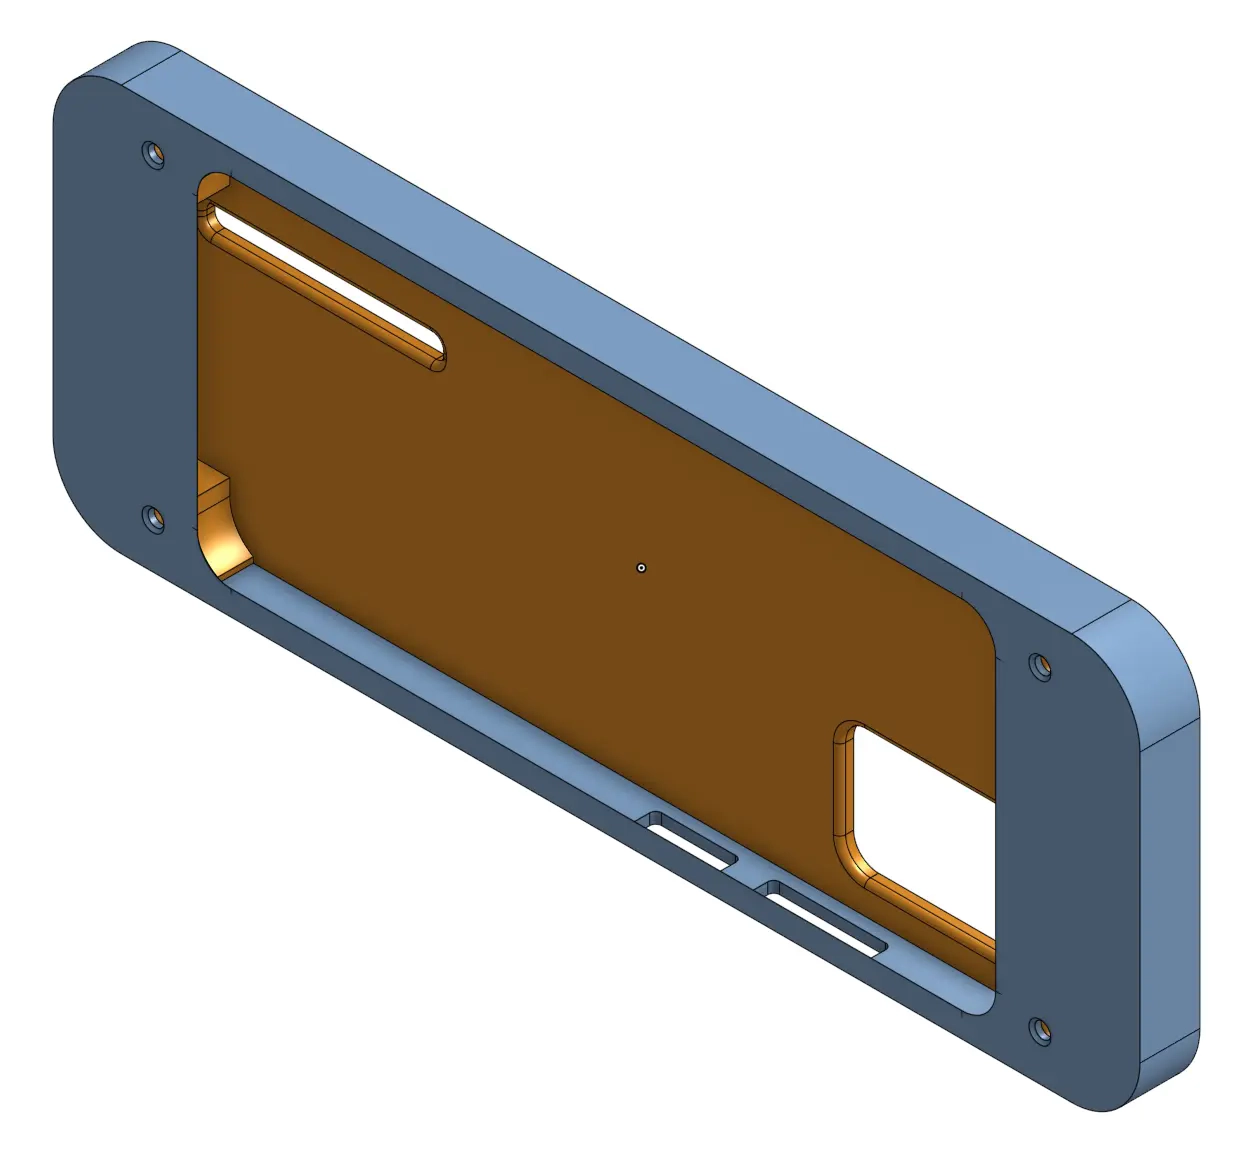
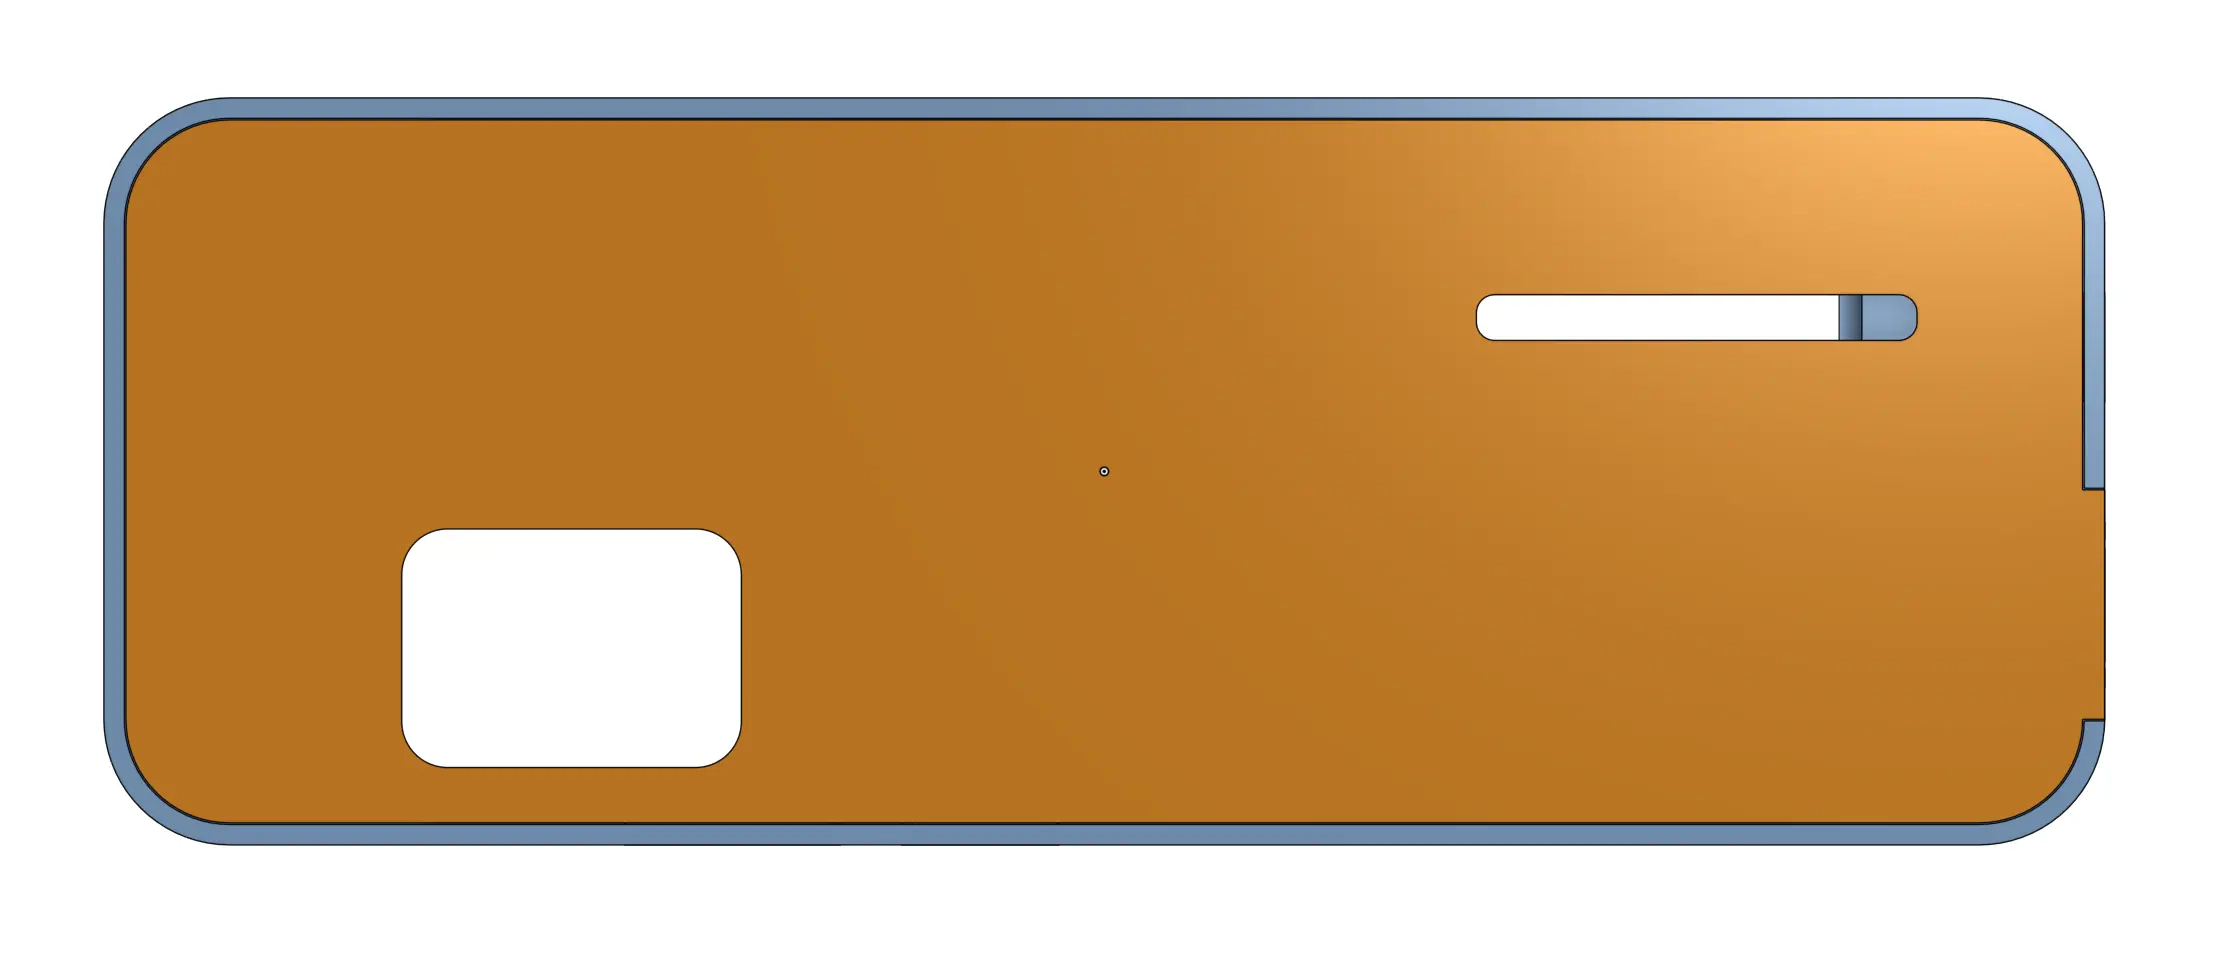
As for the internals, the enclosure needed to house the electronics and the phone itself, without obstructing access to the USB port and the control surfaces (touchscreen, buttons). I opted for a two-part design, consisting of an internal frame, holding the electronics, and an external frame, locking everything into place and providing the minimalistic look.
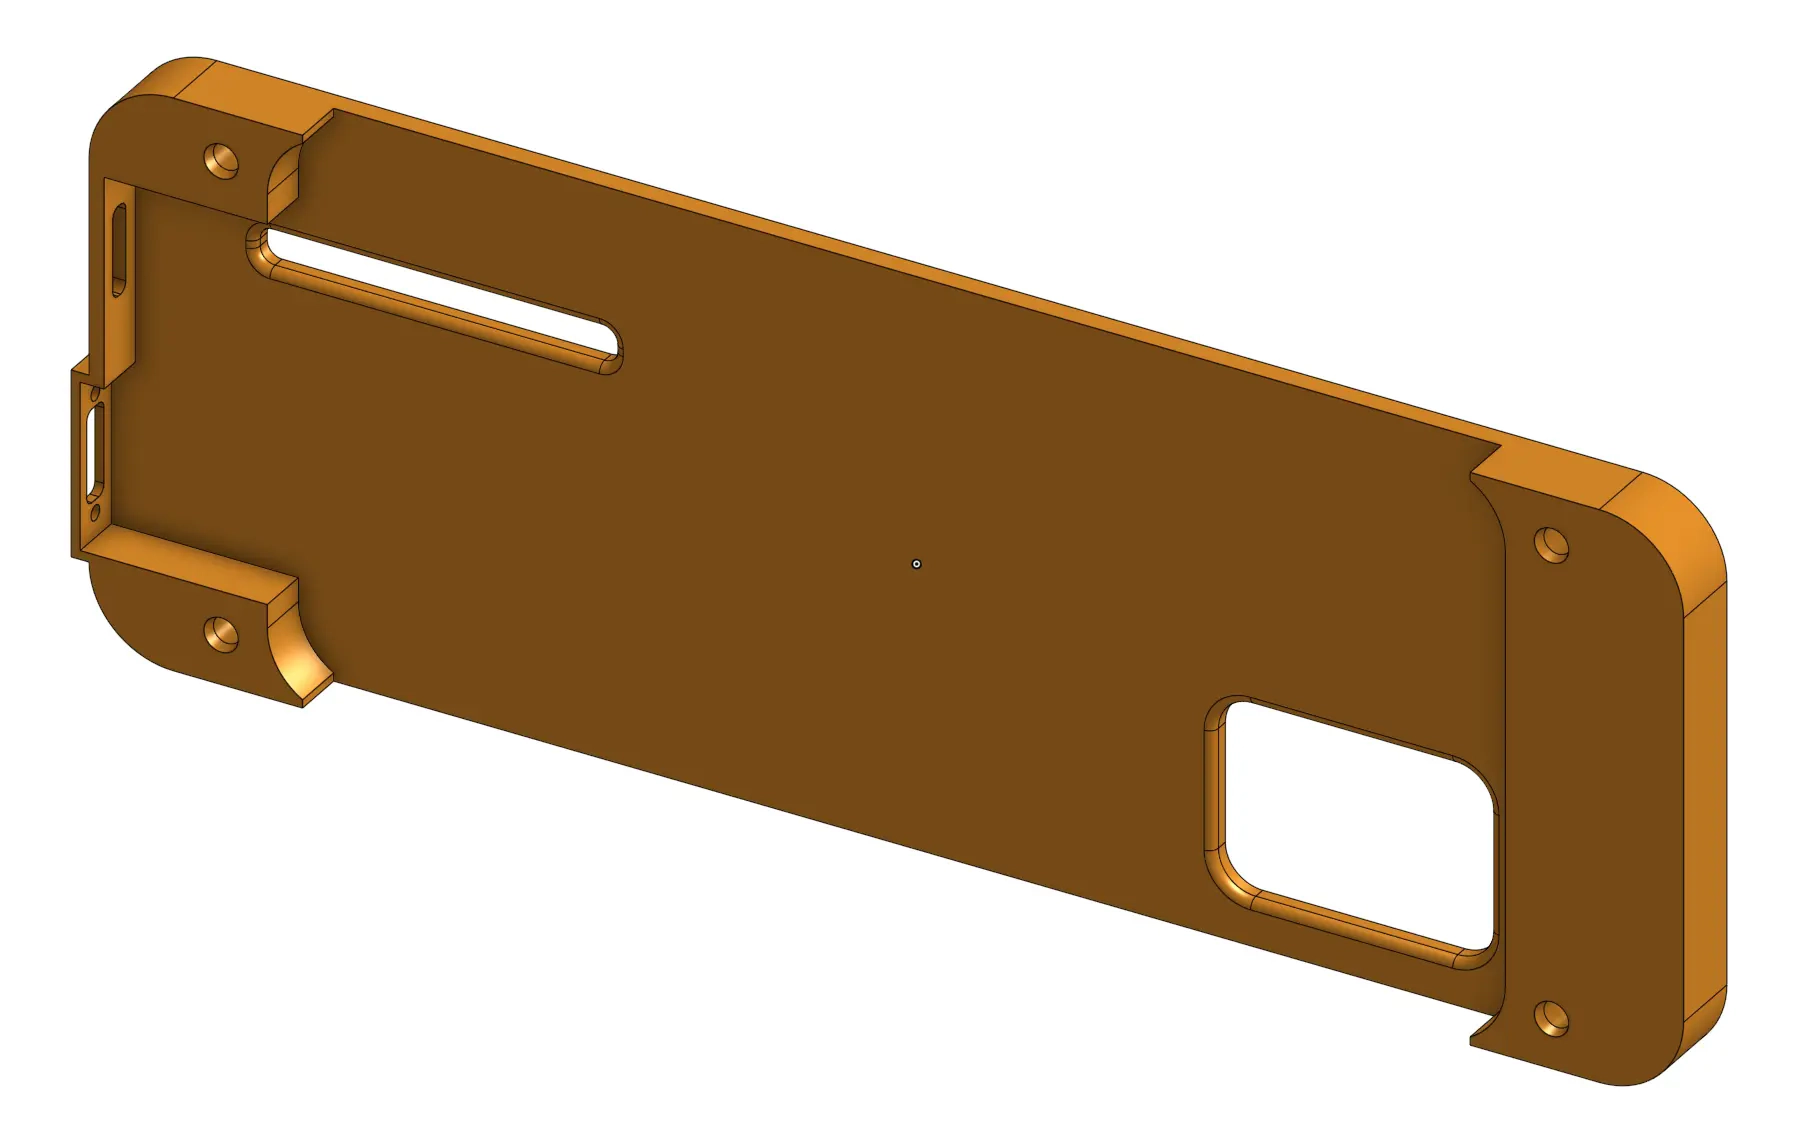
The internal frame had to provide enough backplane thickness, to run the VBAT wire into an electronics compartment and leave some space for the camera module that’s sticking out of the back. Measuring all of the relevant dimensions with a caliper was the most time consuming task of this design stage. This was yet another day I didn’t have to deal with a dead caliper battery, ever since I got an analog one – vernier scale ftw.
The external frame attaches to the internal frame using 8mm M3 bolts, and has a wall-to-wall clearance of 0.2mm, allowing for an easy press fit without noticeable slack. The bolts thread into M3 threaded heat inserts, installed within the internal frame.
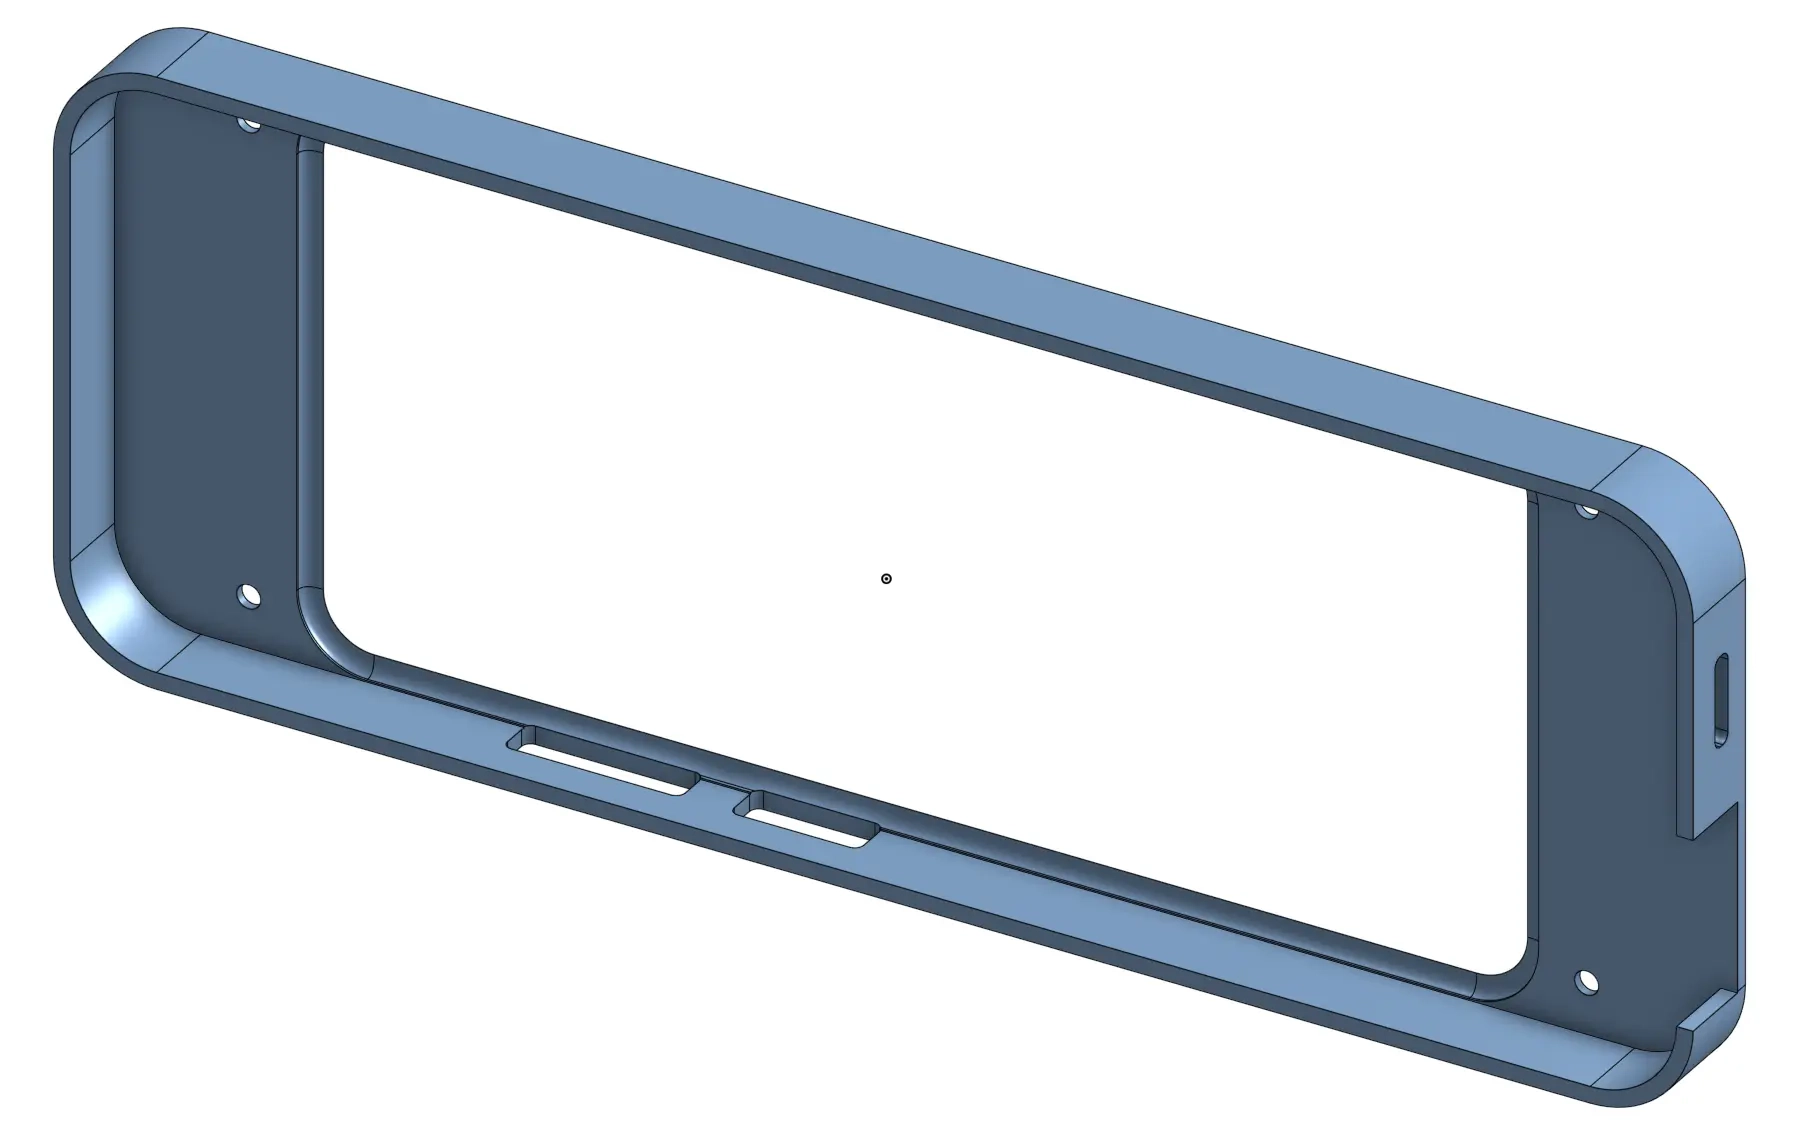
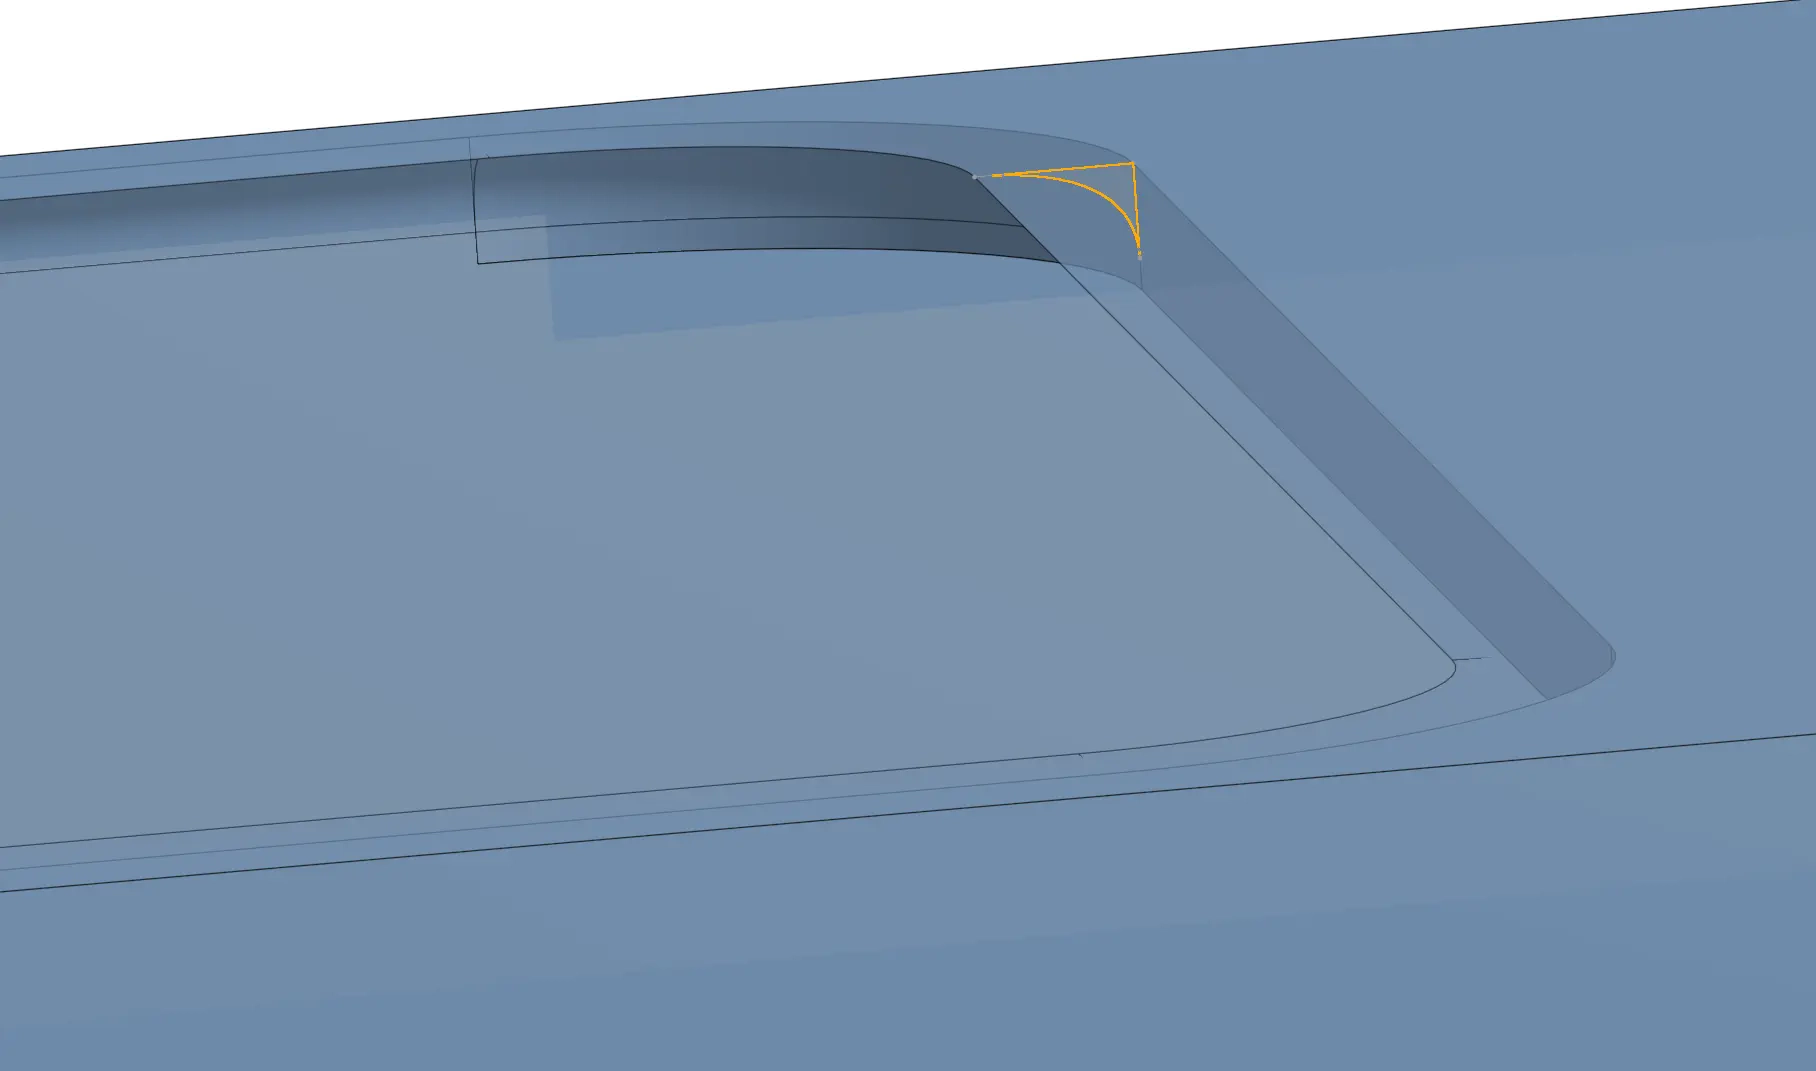
The difficult part here was getting the phone’s curvature and clearances just right, in order for the screen to be flush with the external frame. I don’t have the kind of gear necessary to accurately measure the phone’s curvature, so I somewhat eyeballed it. After all, the 3D printer has a lower limit to the effective layer height, so any deviation beyond 0.2mm (approx. layer height) would get rasterized away by the slicer.
Once both frames were printed, I’ve installed the heat inserts and the USB-C receptacle. A successful power-on test put a huge grin on my face 😁.
I’ve then finished the assembly process, attached velcro strips to both surfaces (enclosure, glass door), and found an angled USB-C cable fit for purpose.
You can find the complete CAD project on my Onshape profile, over here.
Runtime Environment
Grafana, as a web application, imposes the requirement of running some kind of semi-modern web engine. During development, I just used the good ol’ Firefox. However, that’s not the best choice in the long run. Just thinking about the way this dashboard will be used, I’ve come to a couple conclusions regarding typical operation and possible failure modes:
- For the vast majority of time I won’t be looking at the dashboard, hence the screen can be turned off to conserve energy.
- Once the screen is turned off, there must be some trigger mechanism to power it back on, preferably automatic – I don’t want to have to touch the screen or press the power button every time I want to see the dashboard.
- Grafana sessions can expire, how to recover from this state?
- My Grafana instance can experience downtime, how to recover from a failure to load the site?
- Grid power can go down, how does the dashboard recover when the power comes back on?
With all of the above in mind, I’ve found the Fully Kiosk browser. The free version provides access to all of the features, with the exception that enabling paid features also displays a watermark overlaid on the webview. I’ve fiddled around with the configuration and here’s my final setup:
- The Fully Kiosk browser auto-starts on every Android boot.
- In terms of a power outage, the phone already automatically boots, whenever connected to USB power. I literally did nothing to get this auto-boot feature, it’s just how the on-board power management works I guess.
- The target URL is set to a specific dashboard dedicated for the rack dashboard.
- I’ve created and logged in as a separate user with the Grafana kiosk mode enabled.
- Sleep (power off the screen) after 30s of user inactivity.
- Wake up whenever the front camera detects motion. Detection runs at the slowest possible frame rate of 1fps, in order to reduce power consumption.
- On every wake up event, reload the website. This addresses the concerns of session expiry and server-side downtime. The response time is also pretty quick, since the network traffic is limited to the lab network.
I’ve ran this setup for a couple of days as a POC, and then purchased the full license. Great value for the price and I appreciate the developers providing the full feature set for testing.
Moving forward
- Further develop the dedicated dashboard(s), and possibly leverage Grafana playlists.
- See if power consumption can be brought down even further by disabling unused Android features, like the GSM modem. This is more for sport and experimentation, rather than power saving, since the device already barely sips electricity in idle mode.
- Keep exploring the Fully Kiosk browser features, for ways to improve the dashboard’s user experience.